Finviz Is Still The Fastest Stock-Screening Starting Point
Finviz is not trying to be a full trading terminal. Its job is narrower and more useful: help a stock trader go from a broad market to a workable watchlist quickly. The screener, heat maps, group views, news feed, insider transactions and stock pages make it one of the easiest first stops before moving to a dedicated charting platform such as TradingView or a real-time alert engine such as Trade Ideas.
The important distinction is workflow. Finviz is strongest when you need to answer, "what should I look at today?" It is weaker when you need multi-chart execution, custom indicators, options-flow analytics or broker-connected trading. That is why it ranks high in our best stock screeners guide but should usually be paired with a journal such as TraderTrac if you want to know whether the scans are actually producing profitable trades.
What The Free Version Is Good For
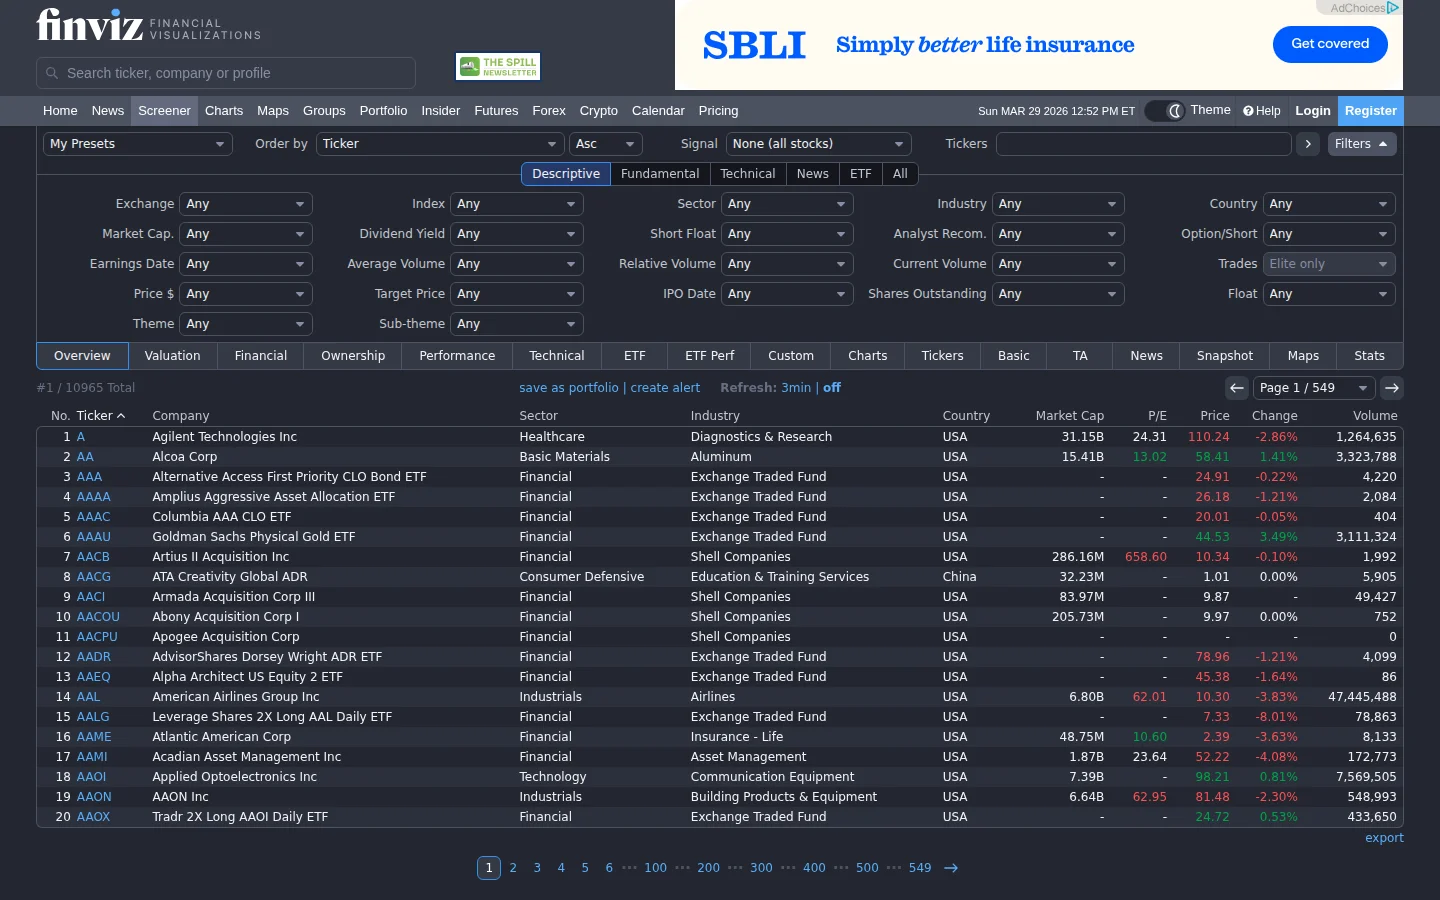
The free Finviz workflow is enough for many swing traders. You can screen US stocks by market cap, sector, industry, volume, relative volume, price performance, valuation, earnings growth, margins, moving-average position, RSI, volatility and pattern-style filters. That combination is why Finviz still shows up in so many trader routines: it makes daily market triage easy.
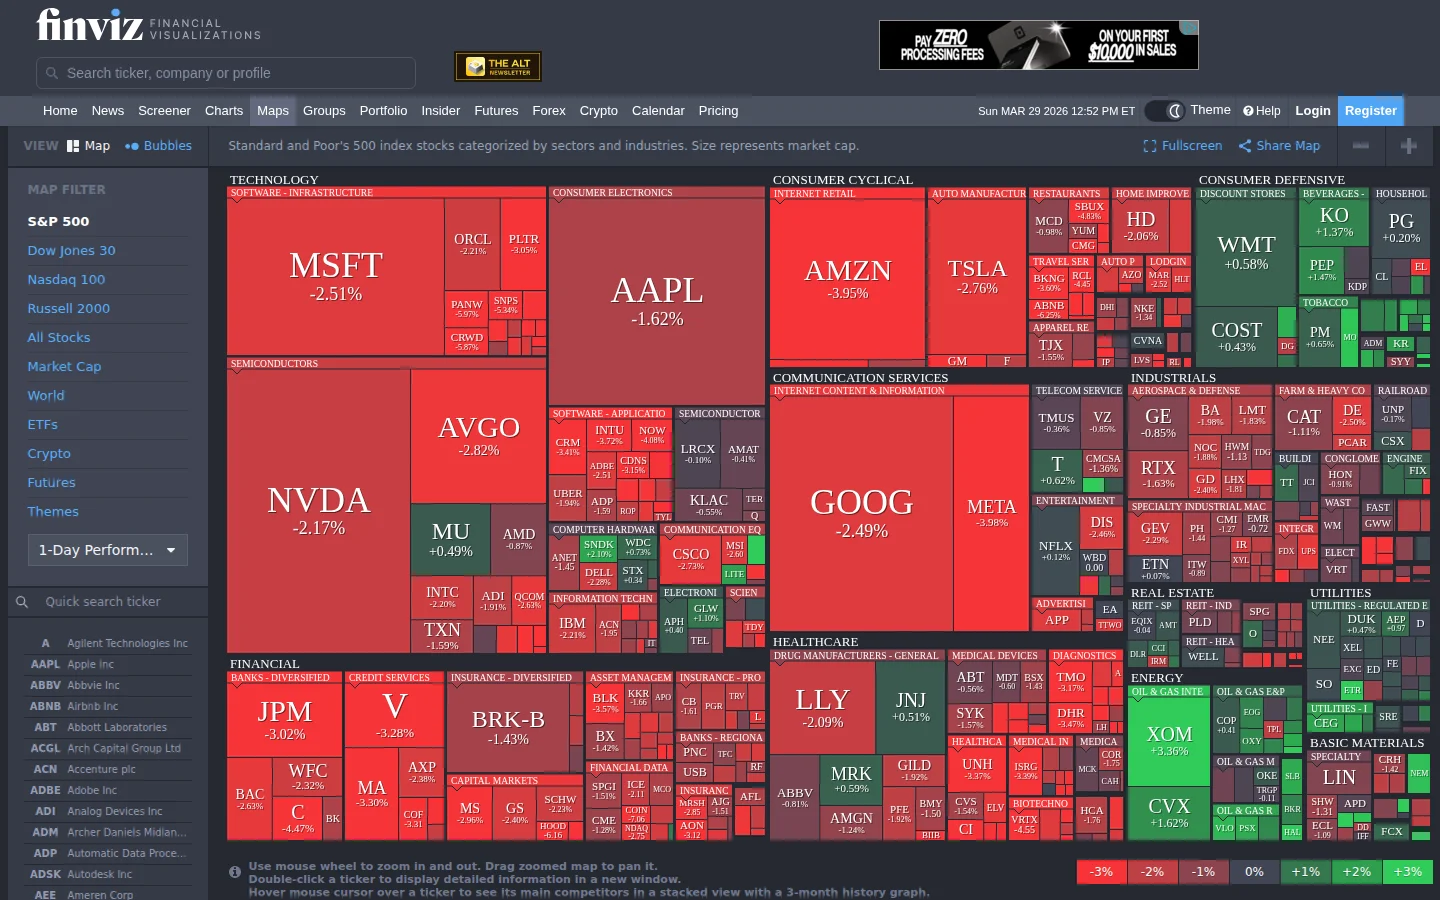
For a practical morning routine, start with broad conditions, not obscure filter stacks. Check the market heat map, look at sector leadership, screen for unusual volume or relative strength, then open a small candidate list in TradingView. If you journal those candidates in TraderTrac afterward, you can see whether the Finviz scan is helping or just creating attractive but low-quality setups.
Finviz Elite: When Paying Makes Sense
Finviz Elite is mainly for traders who need real-time data, more alerting, export, backtesting and an ad-free workflow. The official Finviz FAQ currently lists Elite at $39.50 monthly or $299.50 annually, with a 7-day free trial. That makes the annual plan the better value if Finviz is already part of your daily workflow, but it is not a reason to subscribe before you know exactly how you will use it.
Elite is easiest to justify for active stock traders who prepare watchlists before the open, use premarket movers, export scans, monitor alerts and want real-time refreshes. It is harder to justify if you only run a few end-of-day screens per week. In that case, the free tier plus a stronger charting workflow may be enough.
Where Finviz Falls Short
Finviz is not a serious options platform, not a broker, not a trading journal and not a custom scripting environment. The charts are helpful for context, but they are not a substitute for TradingView, thinkorswim or a broker terminal. The heat maps can also become a vanity feature if you stare at red and green boxes without turning them into a repeatable plan.
The biggest mistake is treating Finviz results as trade signals. A scanner only finds candidates. The trader still needs a thesis, entry, stop, position size and review loop. That is why Finviz works best as the first stage in a process: screen in Finviz, validate on charts, execute in a broker, then review outcomes in a journal.
Best Finviz Workflow
- Use the heat map to identify whether leadership is broad, narrow or defensive.
- Build a simple scan around liquidity, relative volume and your preferred setup type.
- Open the top candidates in TradingView for multi-timeframe chart review.
- Write the reason for each trade before entry, not after the result is known.
- Review scan outcomes weekly in TraderTrac, TradeZella or another journal.
That workflow keeps Finviz in the role where it is strongest: fast idea generation. It also prevents the common problem where a trader keeps adding filters instead of improving execution.
Bottom Line
Finviz remains one of the best free stock screeners because it is fast, useful and easy to keep in a daily routine. Elite makes sense for traders who need real-time scanning and alerting, but Finviz should still be judged as a screener first. If you need deep charting, pair it with TradingView. If you need proof that your screens are helping, pair it with a trading journal.
Sources checked: Finviz FAQ, Finviz screener, and Finviz heat map.