Chart Pattern Scanner Software: The Best Tools for Flags, Pennants, Wedges and Triangles
Most traders who go shopping for a chart pattern scanner make the same discovery we did: the majority of software marketed as "pattern recognition" does not detect chart patterns at all. It detects candlesticks. A hammer is not a pennant. A bullish engulfing bar is not an ascending triangle. That gap is where a lot of subscription money quietly disappears.
This guide separates the tools that genuinely find classic chart geometry — bull flags, pennants, wedges, triangles, head and shoulders, cup and handle — from the ones that only claim to. It covers what each costs, whether it can combine a pattern with a volume filter, and which trading style each one actually suits.
Our founder has used or trialled most of the platforms below personally, and where that is the case we say so. Where we have not tested something first-hand, we say that too.
Your trading style decides which chart patterns matter
Before comparing software it is worth being honest about something vendors gloss over: chart patterns are not universal. The same formation means different things on a 5-minute chart than on a weekly one, and the pattern you should be scanning for depends almost entirely on how long you intend to hold.
Day trading
Day traders work intraday — 1-minute, 5-minute, 15-minute — and close everything before the bell. At that resolution patterns form and resolve in minutes. The formations that matter are the fast continuation ones: bull flags, pennants, opening-range consolidations, and short ascending triangles that break with a burst of relative volume.
A day trading scanner therefore needs two things most tools do not offer together: pattern detection on sub-hourly bars, and real-time rather than 15-minute delayed data. That combination is the most expensive feature in this category and the main reason day trading software costs more than swing trading software.
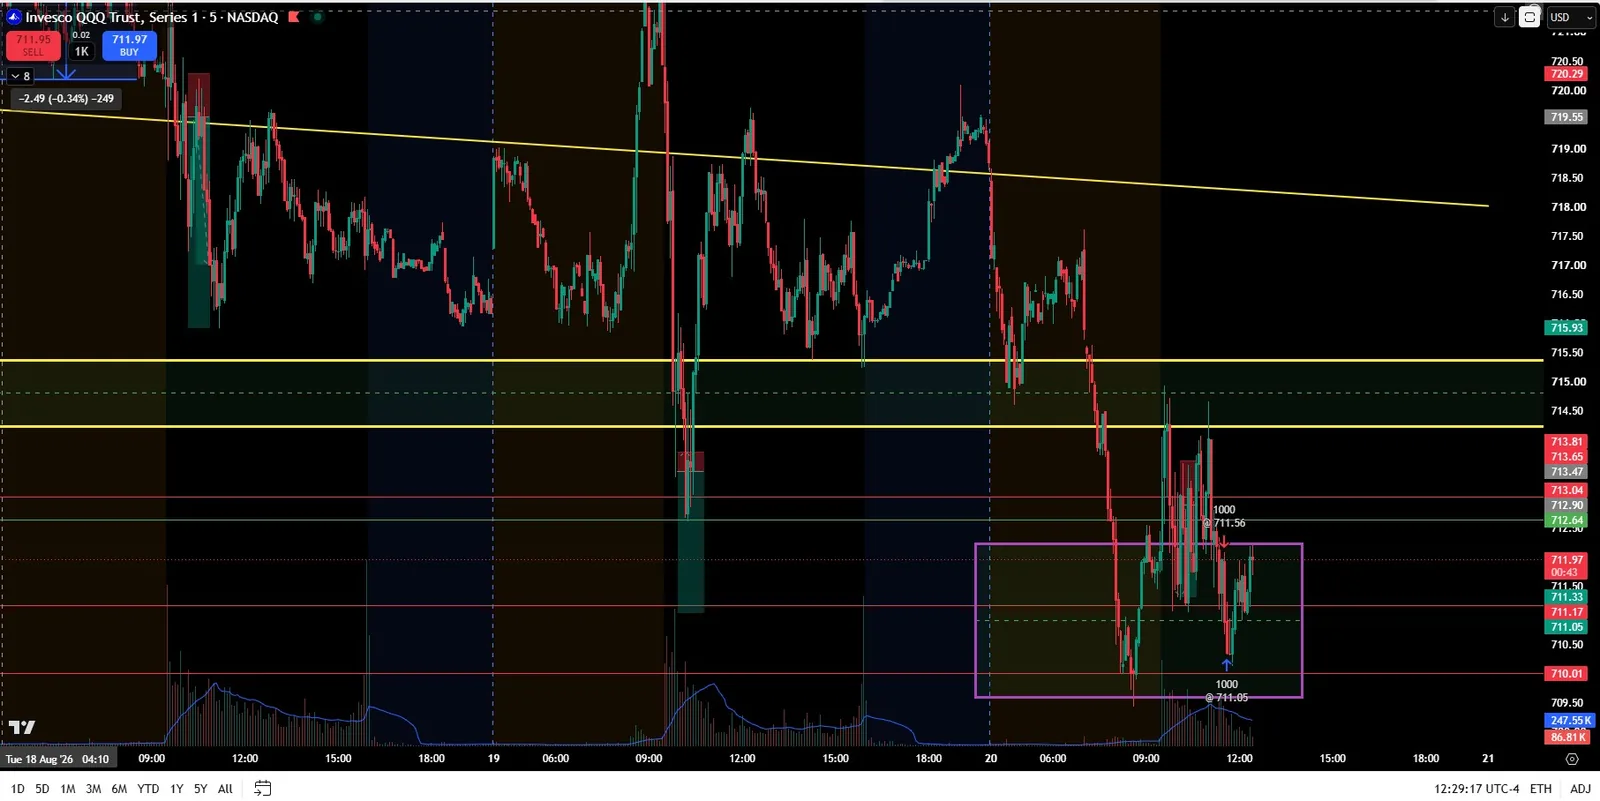
Worth noting: a bull flag on a 5-minute chart is a fundamentally noisier signal than the same shape on a daily chart. There are fewer bars in it, so the trendline fit rests on fewer swing points. Intraday pattern scanning throws far more false positives, and any day trader relying on it needs a hard volume filter to cut through.
Swing trading
Swing traders hold days to weeks and work primarily off the daily chart, using the weekly for context. This is the timeframe classic chart pattern trading was built for, and where automated detection performs best — more bars, cleaner swing points, more reliable trendlines.
Swing trading is also where pattern scanning delivers the most value per dollar. A daily scan run once after the close, producing a shortlist of twenty or thirty consolidating names, is a genuinely efficient workflow. And because you are not paying for real-time intraday data, a capable swing trading scanner costs well under $30 a month.
The relevant formations are the multi-week consolidations: bull flags after a strong advance, pennants and symmetrical triangles coiling toward an apex, ascending triangles grinding at flat resistance, falling wedges in a pullback, and cup-and-handle bases.
Position trading and investing
Longer-horizon traders work weekly and monthly, where patterns take months or years to complete — head and shoulders tops, multi-year cup-and-handle bases, long rectangles, broadening formations.
Here, honestly, automated scanning matters least. An investor is not screening 8,000 tickers nightly for geometry; they are usually working a watchlist of names they already understand fundamentally, with the chart as a timing overlay rather than an idea source. A free tool is generally enough.
Practical takeaway: if you swing trade, nearly every tool below will serve you and the cheap ones will serve you well. If you day trade, your options narrow sharply and get expensive. If you invest, you probably do not need to pay for this at all.
Volume is half the pattern
This is what separates traders who use chart patterns well from traders who merely collect them.
A chart pattern is a picture of supply and demand reaching a temporary truce. The shape tells you the truce exists. Volume tells you who is winning. Every classic pattern has a volume signature, and a formation that looks perfect with the wrong volume behaviour is a formation to skip.
This is why volume analysis is not an optional extra on a pattern scanner — it is the confirmation layer. It is also exactly what separates the tools below. Plenty of platforms will tell you a triangle exists. Far fewer let you say: show me the triangle, and require that volume contracted at least 40% through the consolidation, and that the breakout bar traded twice its 50-day average. That combined filter is the whole game.
The next section covers each pattern's volume signature specifically.
The nine chart patterns worth scanning for — and their volume signatures
Bull flag pattern
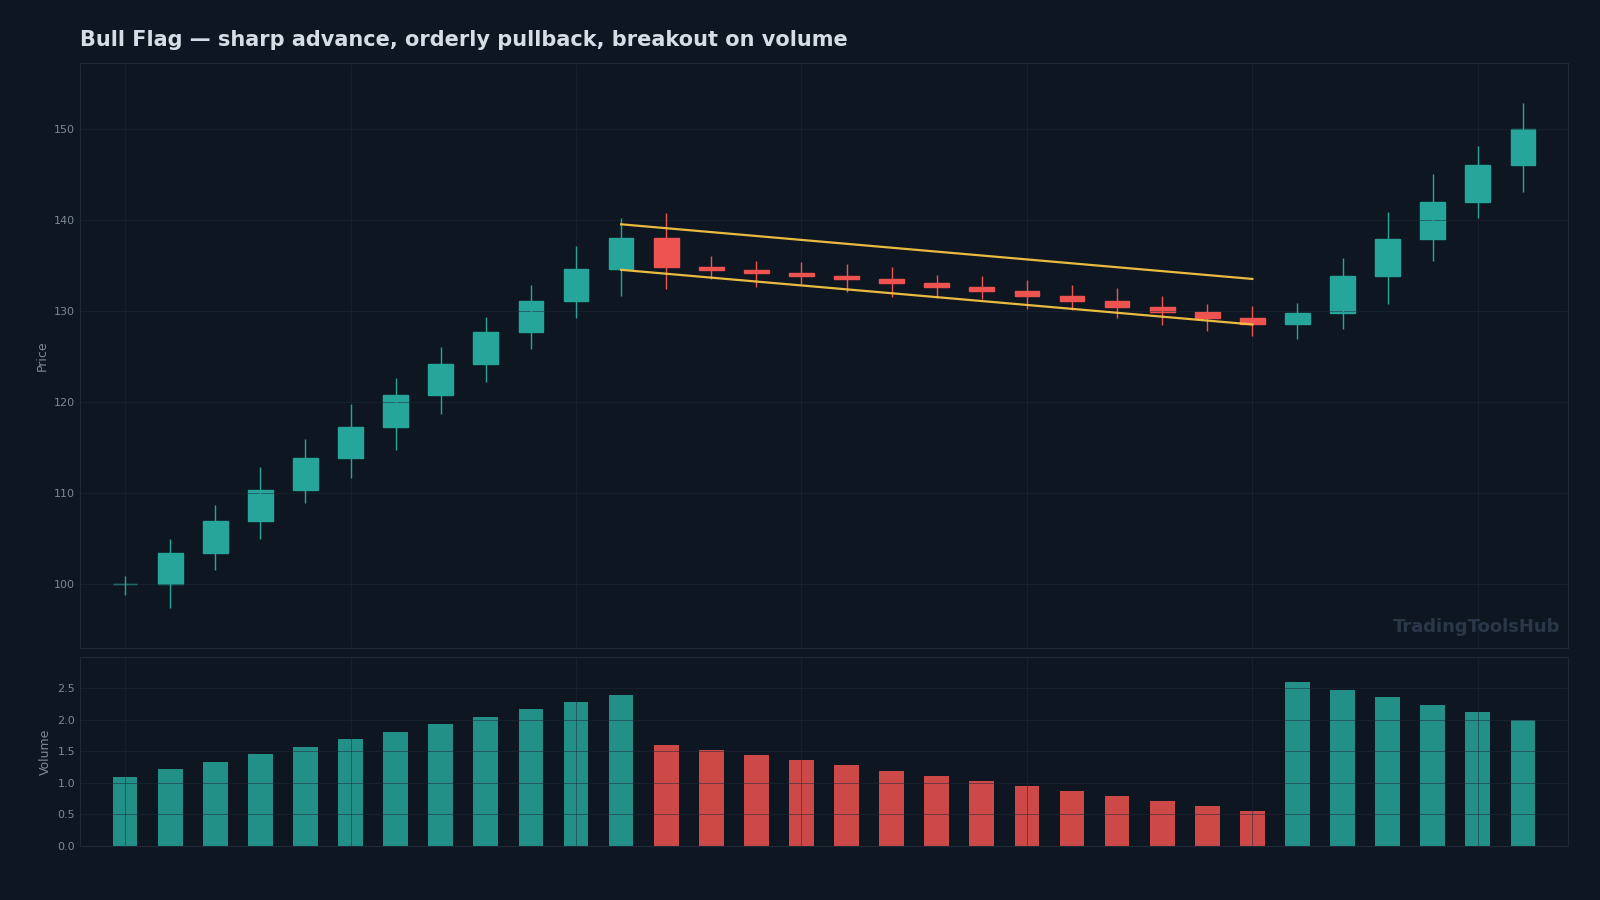
A bull flag is a sharp, high-volume advance (the flagpole) followed by a shallow, orderly pullback that drifts slightly against the trend inside two roughly parallel lines. It is the most-traded continuation pattern in the market and works on every timeframe from 1-minute to weekly.
Volume signature: heavy on the flagpole, then progressively drying up through the pullback. That dry-up is the entire point — it says sellers lost interest rather than that buyers got overwhelmed. On the break of the upper flag boundary, volume should expand again to at least 1.5× the recent average. A bull flag forming on rising volume through the consolidation is usually distribution wearing a costume.
Which scanners find it: MarketInOut, ChartMill, Tickeron, Trading Central (free via brokers), thinkorswim. Not Finviz — though a Channel Down combined with a strong prior-month performance filter is a workable proxy.
Bullish pennant
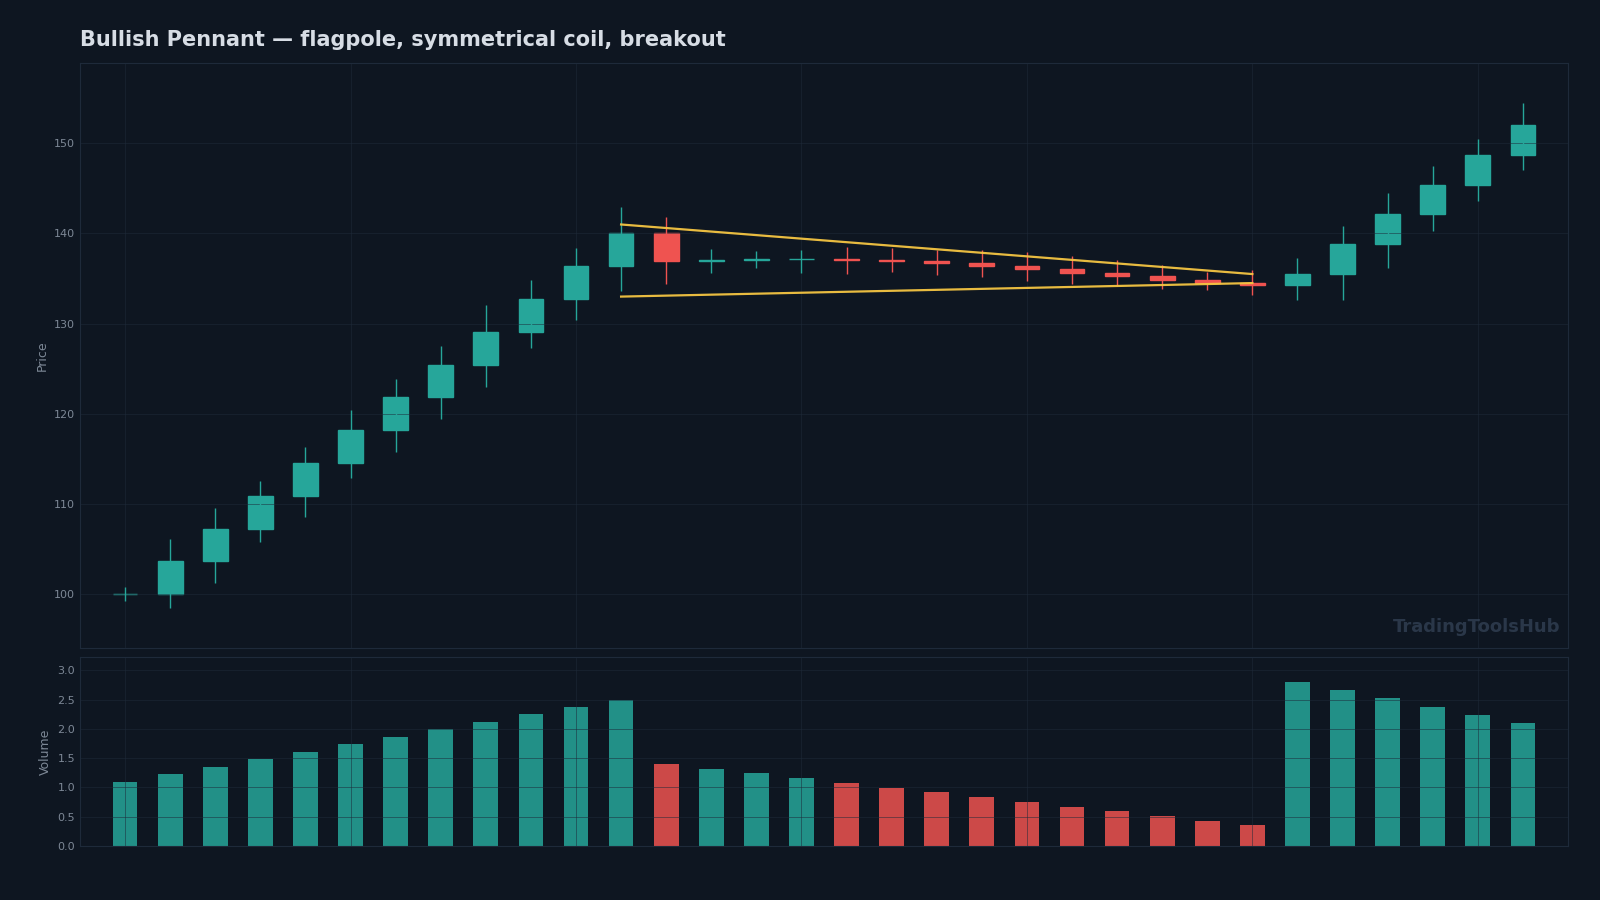
A bullish pennant is a flagpole followed by a small symmetrical triangle rather than a parallel channel — the two boundary lines converge instead of running parallel. Shorter and tighter than a flag, typically one to three weeks on a daily chart.
Volume signature: the contraction is more dramatic than a flag's. As the lines converge toward the apex, volume often falls to multi-week lows. The market coils. The breakout bar is where volume should reappear decisively. A pennant that reaches its apex without a volume expansion usually fails or resolves sideways.
Which scanners find it: MarketInOut, ChartMill, Tickeron, Trading Central. Finviz's symmetrical Wedge filter is geometrically close enough to serve as a substitute.
Ascending triangle
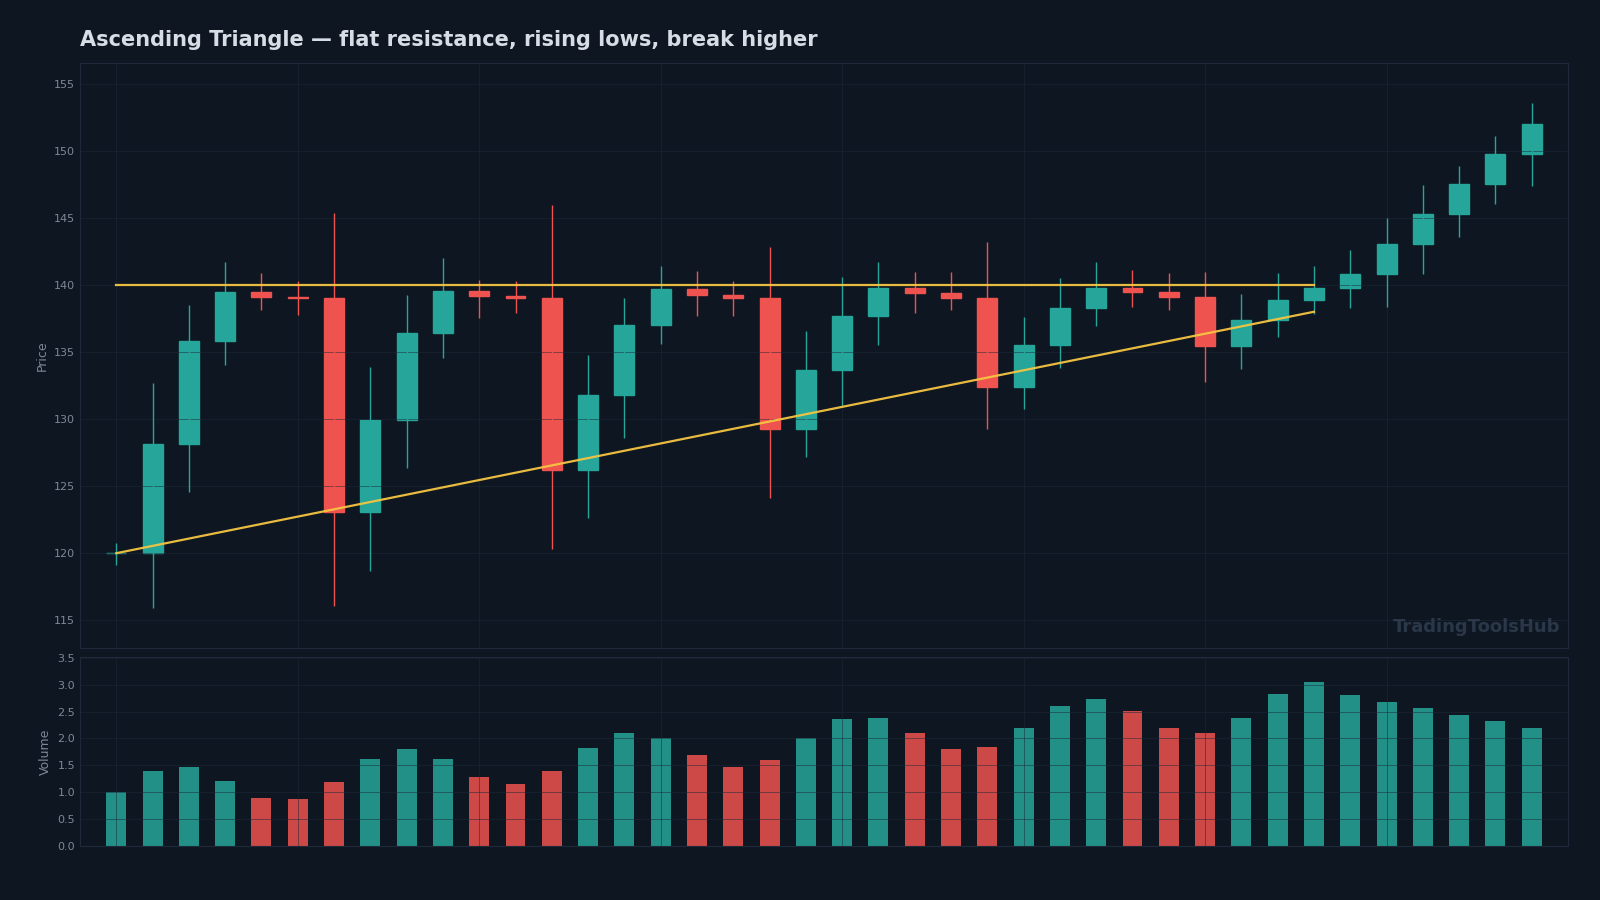
An ascending triangle has a flat horizontal resistance line above and a rising trendline of higher lows beneath. Buyers step in progressively higher while a fixed supply sits at one price. Generally bullish, and one of the more reliable continuation patterns on a daily chart.
Volume signature: volume tends to build gradually on each successive push into the flat resistance, as if buyers test the ceiling with increasing confidence, then expands sharply on the break. Unlike flags and pennants, you are not looking for a dry-up here — you are looking for accumulating pressure.
Which scanners find it: Finviz (Triangle Ascending), TrendSpider, MarketInOut, ChartMill, Tickeron, thinkorswim.
Descending triangle
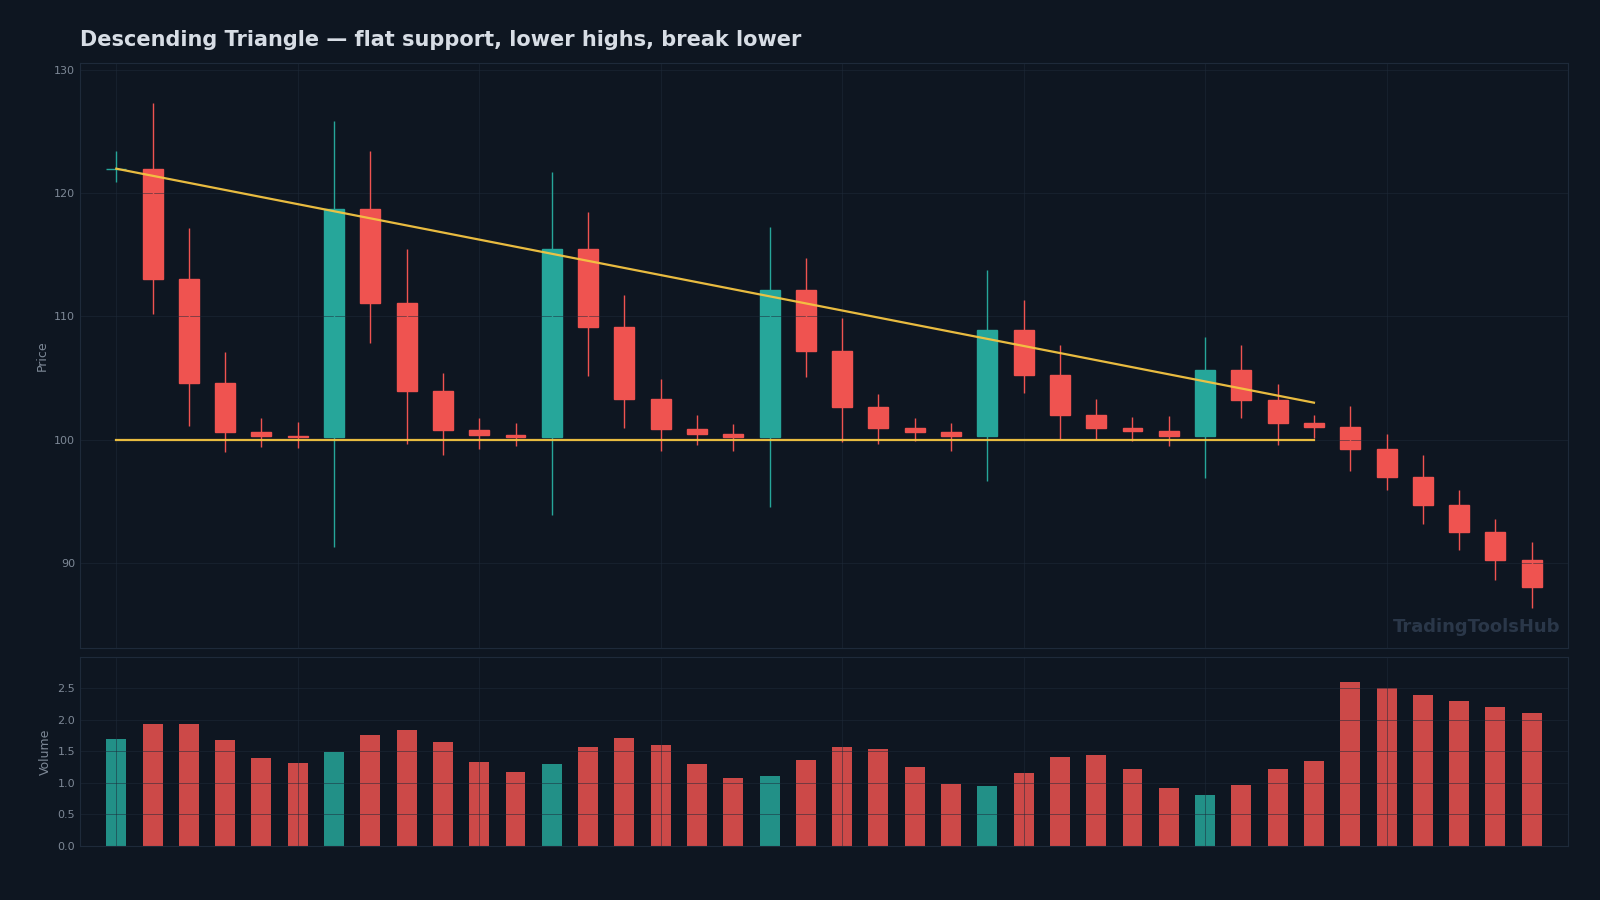
The mirror image: flat horizontal support below, a falling trendline of lower highs above. Sellers press progressively lower against a fixed bid. Generally bearish, though in a strong uptrend it can resolve upward often enough that direction should not be assumed.
Volume signature: volume typically contracts through the formation and expands on the break. A high-volume close beneath the flat support line is the confirmation; a low-volume undercut that recovers is frequently a shakeout.
Which scanners find it: Finviz (Triangle Descending), TrendSpider, MarketInOut, ChartMill, Tickeron.
Symmetrical triangle
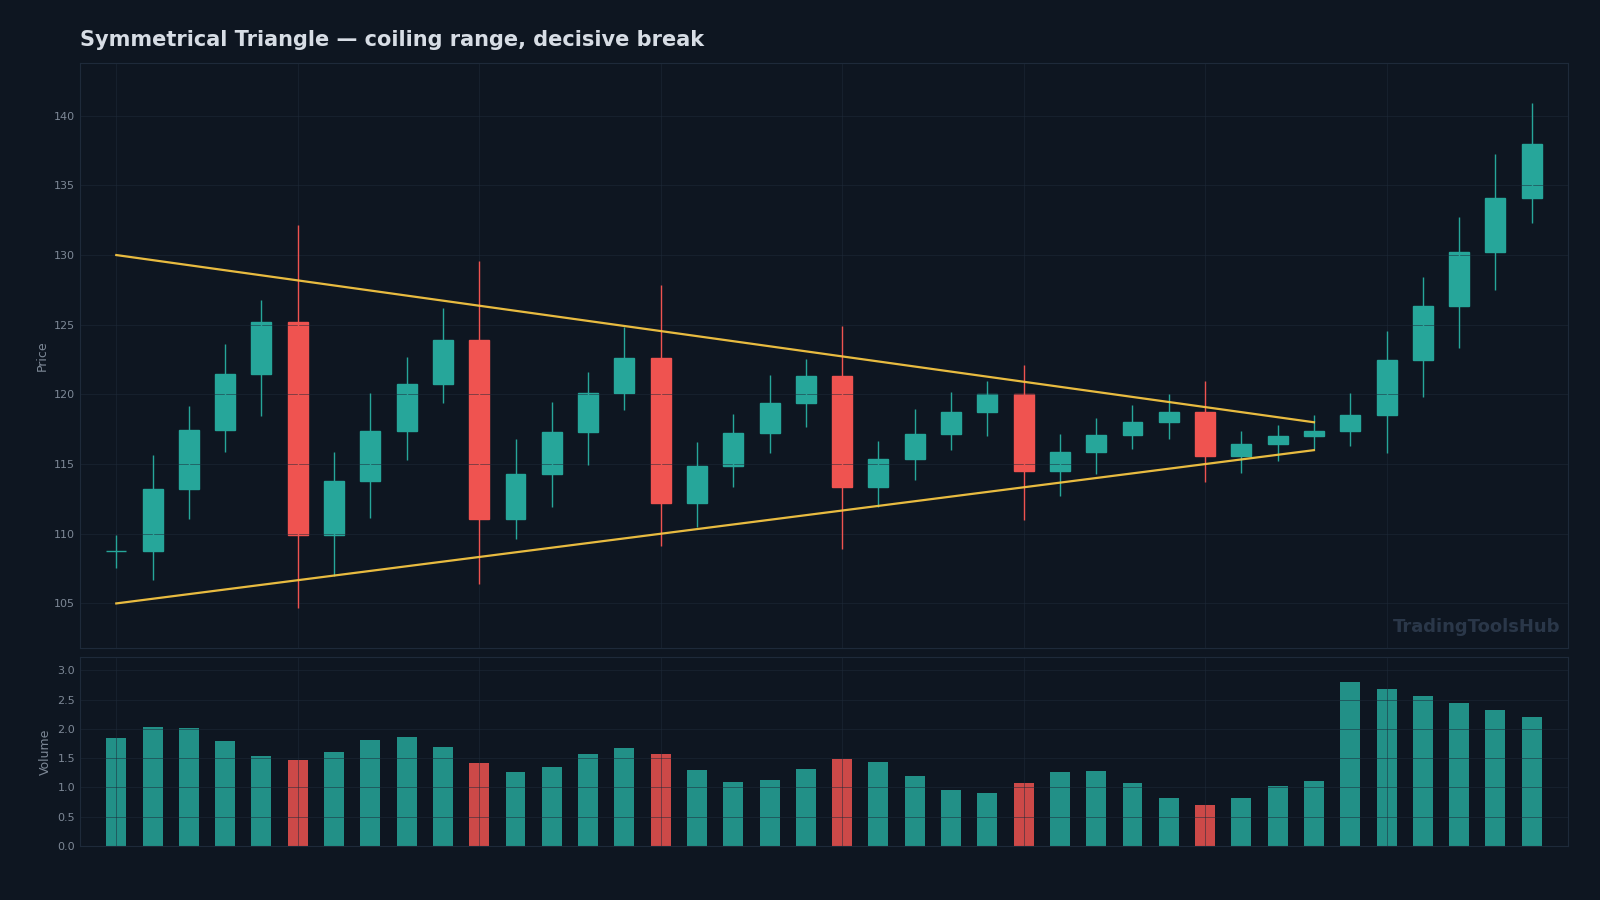
Two converging trendlines, neither horizontal — lower highs and higher lows compressing toward an apex. A symmetrical triangle is direction-neutral by construction: it tells you a decision is coming, not which way. Longer-duration versions on daily charts are among the cleanest setups automated detection handles well.
Volume signature: steady contraction throughout, often to the lowest readings in a month or more, followed by expansion on the resolution. Trade the break, not the apex — and require the volume.
Which scanners find it: Finviz (Wedge), TrendSpider, MarketInOut, ChartMill, Tickeron.
Falling wedge
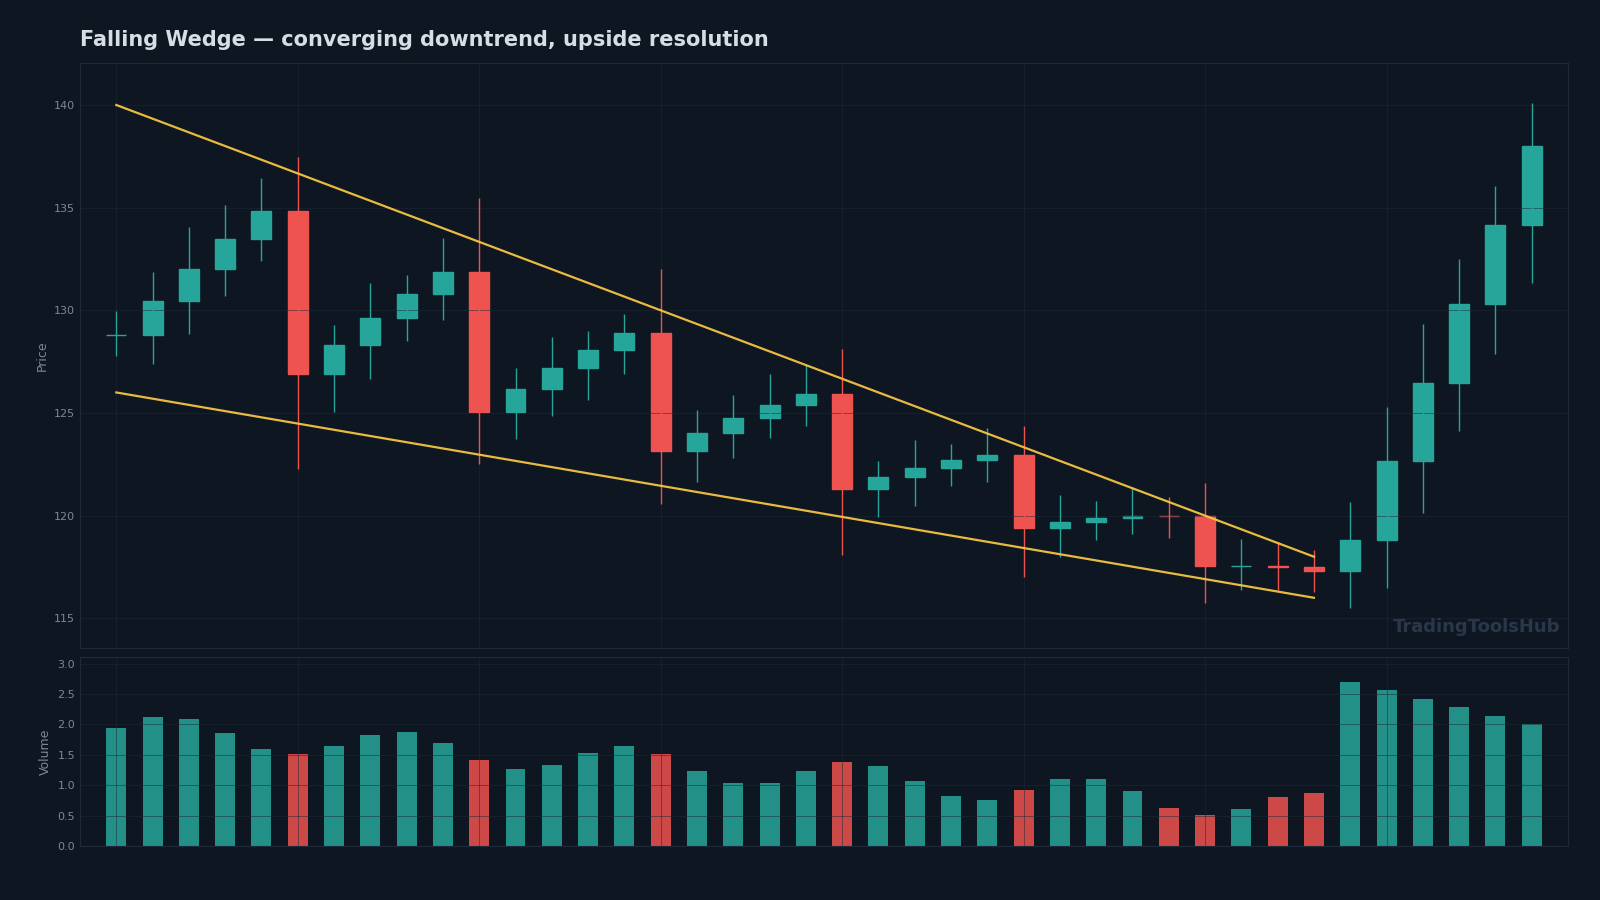
A falling wedge has both boundary lines sloping down but converging — lower highs and lower lows, with the highs falling faster. In an uptrend it is a bullish continuation pattern; after a sustained downtrend it can mark a reversal.
Volume signature: volume should decline steadily as the wedge deepens, then expand clearly on the upside break. This is the diagnostic test. If volume is rising as the wedge extends lower, that is real selling pressure and not a pause — the pattern is more likely to fail.
Which scanners find it: Finviz (Wedge Down), TrendSpider, MarketInOut, ChartMill, Tickeron, Trading Central.
Rising wedge
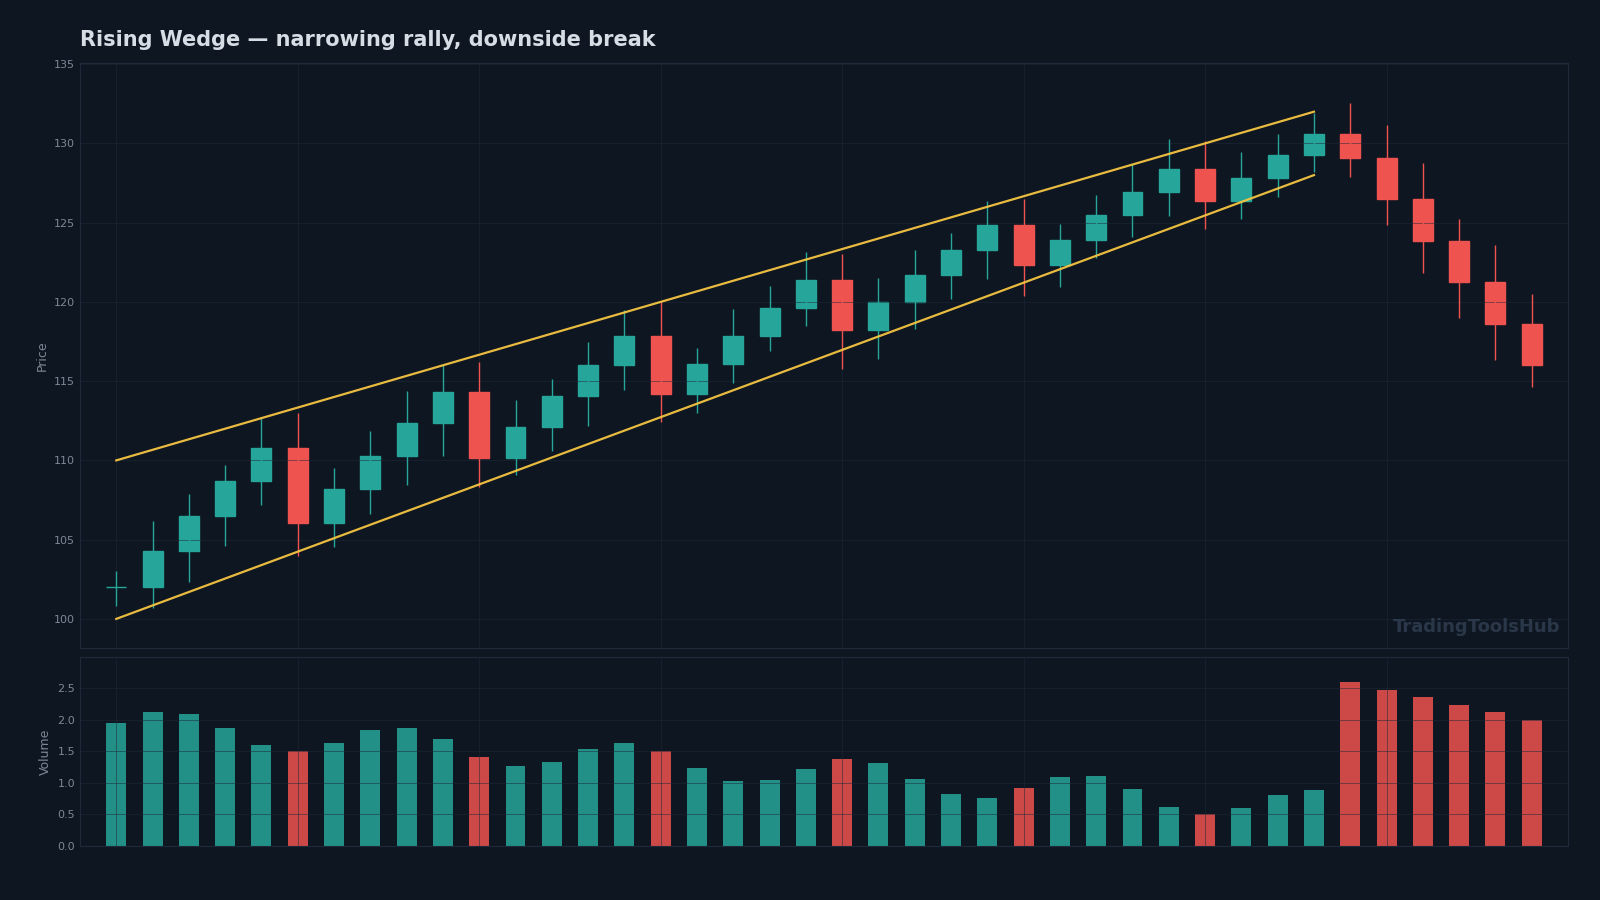
Both lines slope up and converge, with the lows rising faster than the highs. A rising wedge is generally bearish — price is grinding higher on progressively narrower range, which is a picture of buying exhaustion rather than strength.
Volume signature: the tell is declining volume on a rising price. Advances on shrinking participation are structurally weak. The breakdown through the lower boundary should come on expanded volume.
Which scanners find it: Finviz (Wedge Up), TrendSpider, MarketInOut, ChartMill, Tickeron.
Head and shoulders pattern
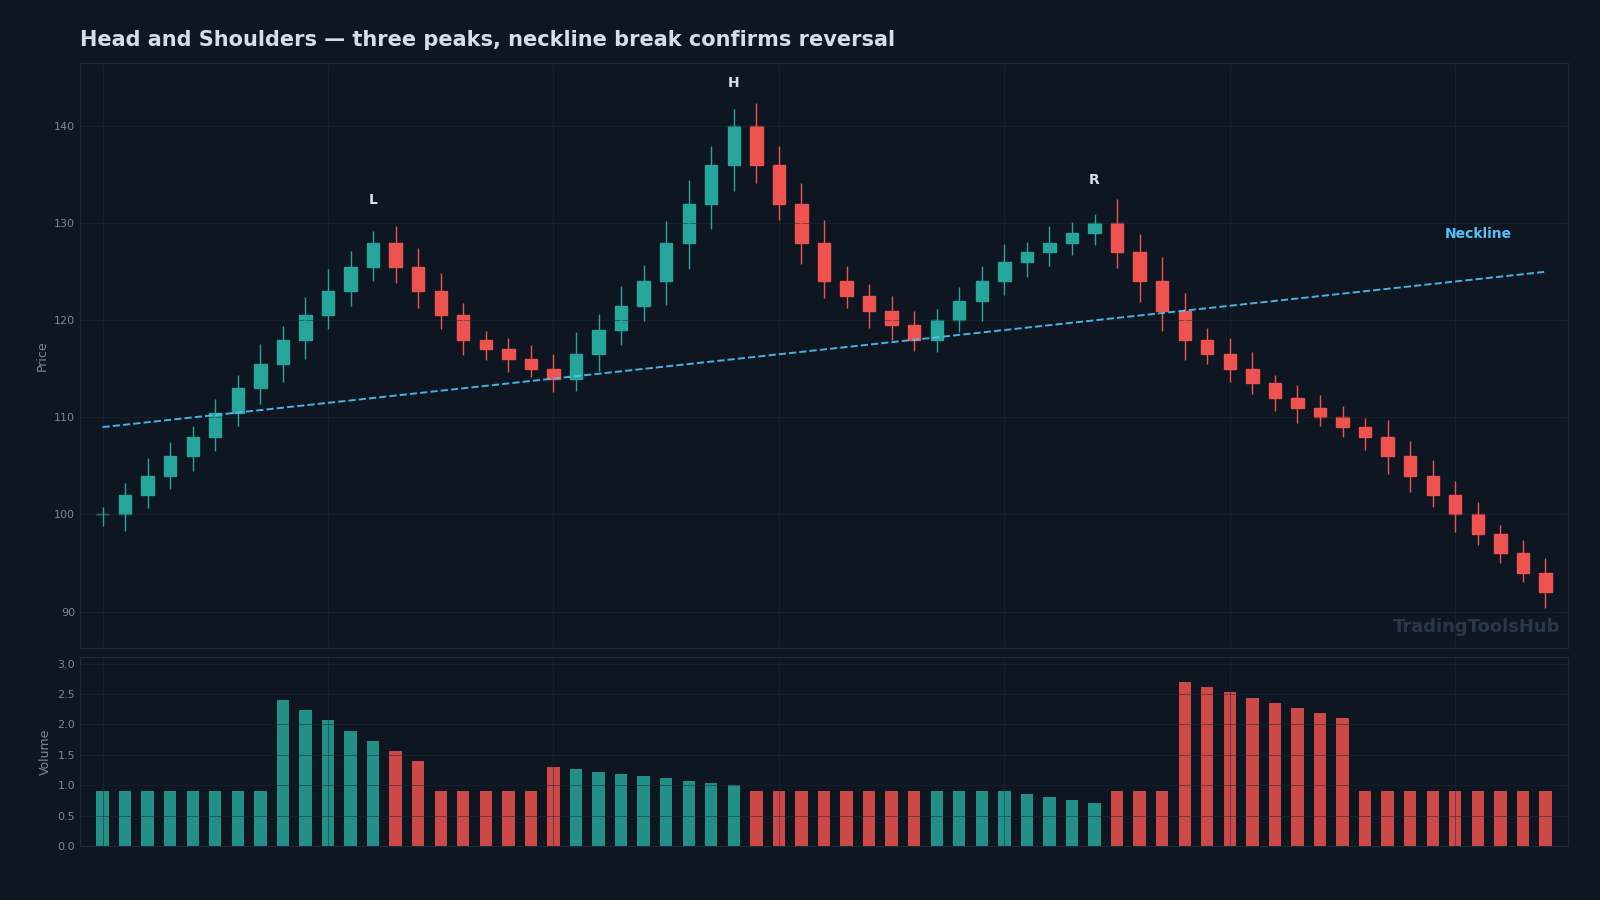
Three peaks — a left shoulder, a higher head, a lower right shoulder — with a neckline drawn across the intervening lows. The head and shoulders pattern is the best-known reversal formation in technical analysis, and the inverse version marks bottoms.
Volume signature: this is where most traders get it wrong. Volume should be heaviest on the left shoulder, lighter on the head, and lightest on the right shoulder. That declining participation across a formation that is still making new highs is the actual warning — the price structure alone is not enough. The neckline break should come on a clear volume expansion. On an inverse head and shoulders, look for the opposite: volume building into the right shoulder and surging through the neckline.
Which scanners find it: Finviz (Head & Shoulders and H&S Inverse), TrendSpider, MarketInOut, ChartMill, Tickeron, Trading Central, thinkorswim.
Cup and handle
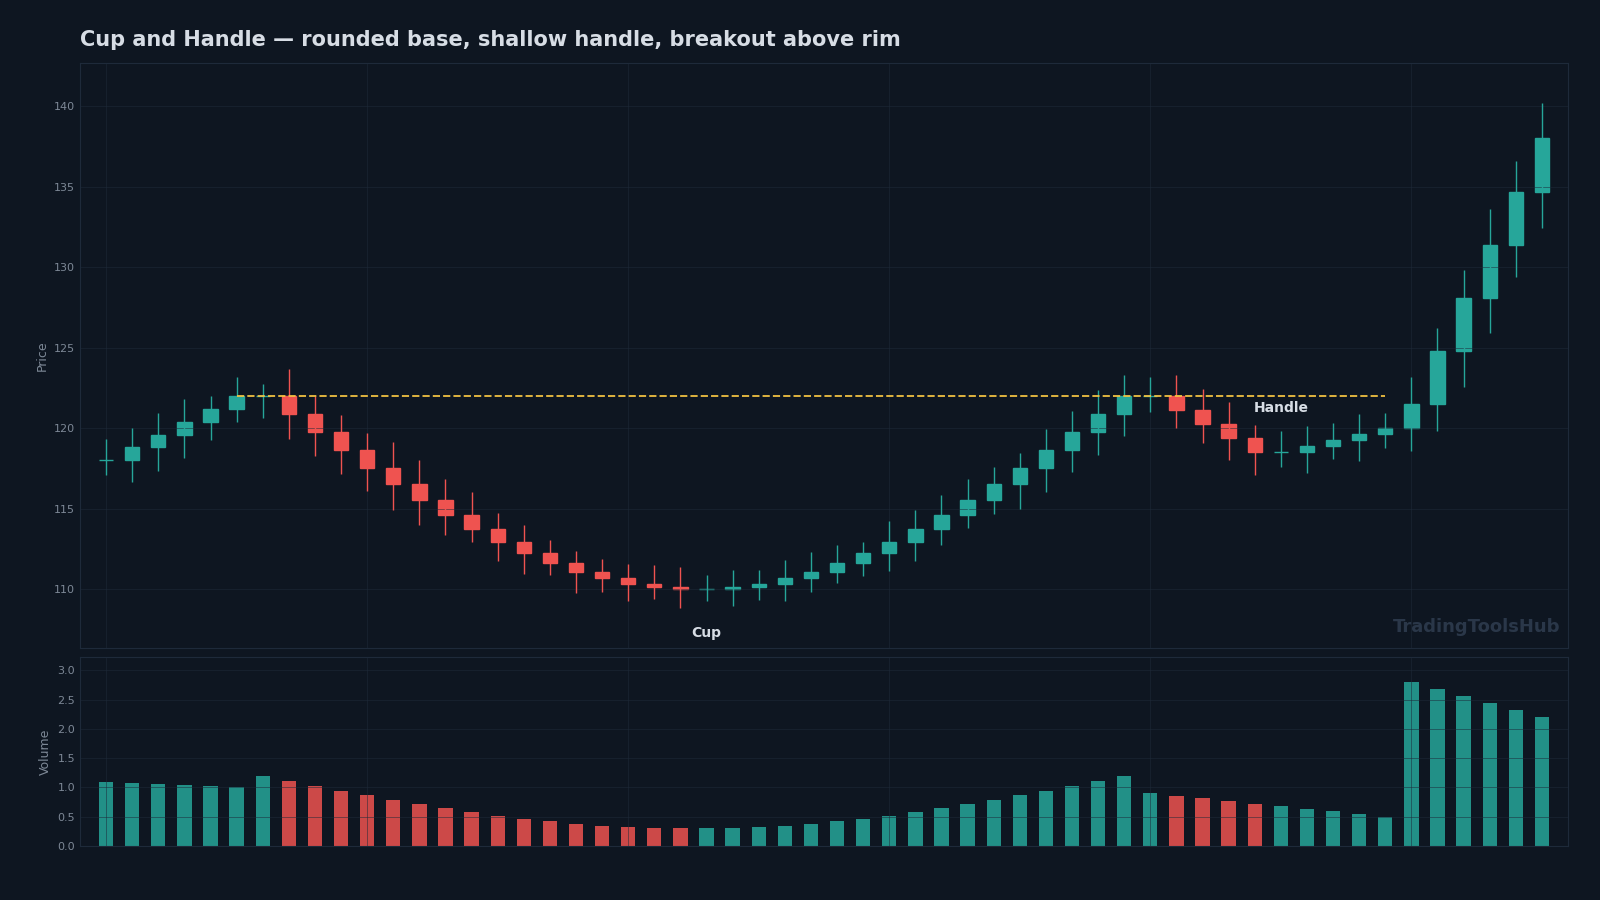
A rounded U-shaped base followed by a shallow pullback that forms the handle. Cup and handle bases develop over months on daily and weekly charts and are a staple of longer-horizon breakout trading.
Volume signature: volume dries up through the base of the cup — the point of maximum disinterest — then builds up the right side, contracts again through the handle, and expands hard on the breakout above the handle's high. The handle's volume dry-up is the quality filter; a handle on heavy volume is usually distribution.
Which scanners find it: TrendSpider, MarketInOut, ChartMill, Tickeron. Not Finviz.
Three kinds of "pattern scanner" — know which you are buying
One framework that will save you money:
1. Candlestick pattern scanners. These detect one, two or three-bar formations — doji, hammer, engulfing, morning star. Mechanically simple, accurate at what they claim, available almost everywhere including free tiers. They are not chart pattern scanners, however often they are marketed as such. If you searched for candlestick patterns specifically, this is what you want; if you searched for chart patterns, it is not.
2. Chart geometry scanners. These fit trendlines to swing highs and lows and identify the multi-week formations covered above. Genuinely harder to build, and correspondingly rarer.
3. Indicator proxies. These do not detect geometry at all — they approximate a pattern with numeric filters: volatility contraction, tight closing ranges, narrow Bollinger bands, percentage-range compression over N days. Often more useful than fuzzy geometry detection, but sold in pattern language that overstates what is happening underneath.
Most confusion in this market comes from vendors describing category 1 or 3 using the vocabulary of category 2.
Chart pattern scanner comparison
| Software | Detects chart geometry? | Flags & pennants? | Volume + pattern in one screen? | Price (USD) |
|---|---|---|---|---|
| TrendSpider | Yes — best in class | Partial (wedges, triangles, channels, cup & handle) | Yes, fully | $54/mo annual · $82/mo monthly |
| Finviz Elite | Yes — 17 patterns | No | Yes, native | $39.50/mo · $299.50/yr ($24.96/mo) |
| MarketInOut | Yes — widest library | Yes | Unconfirmed | $159/6mo · $259/yr · $359/2yr |
| Tickeron | Yes — 39 patterns | Yes | Unconfirmed | From $30/mo after 14-day trial |
| ChartMill | Yes — 29 chart patterns | Yes | Yes | ~$30/mo · ~$260/yr (see note) |
| TradingView | Community script only | Depends on script | Yes, if scripted | $59.95/mo annual (Premium) |
| TC2000 | No — candlesticks + custom formulas | No | n/a | $24.99 · $49.99 · $99.99 per mo |
| Barchart | No — candlesticks only | No | n/a | Free · $9.99 · $29.95 per mo |
| StockCharts | No — candlesticks + Point & Figure | No | n/a | $14.95 · $24.95 · $39.95 per mo |
| Deepvue | No — on their roadmap | No | n/a | $49/mo · $41/mo annual |
| thinkorswim | Yes — Classic Patterns | Yes | Yes, incl. volume sensitivity | Free with Schwab account |
| Trading Central | Yes | Yes | Yes | Free inside IBKR, Schwab, E*TRADE, Fidelity |
| AmiBroker + WiseTrader | Yes — coded | Yes, if you build it | Yes, fully | ~$600 one-time, perpetual |
Prices verified against vendor pricing pages, August 2026. Exceptions flagged in the reviews below.
The software, reviewed
TrendSpider — the best chart pattern scanner, if you can justify it
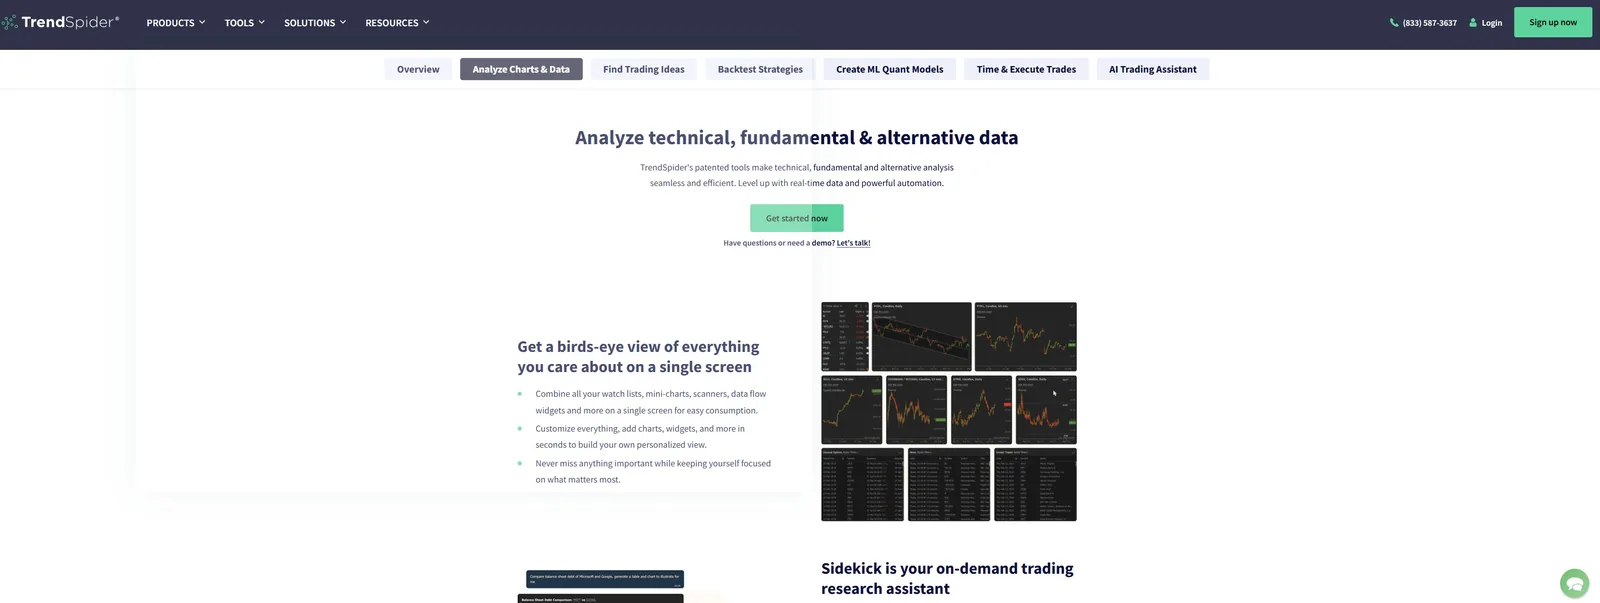
TrendSpider automatically detects ascending, descending and symmetrical triangles, rising and falling wedges, horizontal, ascending and descending channels, double tops and bottoms, head and shoulders and its inverse, and cup and handle. Critically, those patterns are available as scanner conditions rather than just annotations drawn on a chart — the distinction that makes a pattern feature useful rather than decorative.
You can stack volume, indicator and price conditions in the same scan, run it on any timeframe, and set alerts that fire when a detected pattern actually breaks out instead of re-running screens manually. The automated trendline drawing is the best in the category by a clear margin.
Our founder has used TrendSpider and rates it highly. The software is genuinely excellent and the customer support is among the best in this market — not a small thing when you are learning a complex scanner. The reservation is purely price.
Pricing: Standard is $54/month on annual billing, $82/month billed monthly. Premium $91 annual, Enhanced $122, Advanced $214. Each tier offers a 14-day paid trial from $19.
One clarification, because it is widely misreported: TrendSpider's Standard tier is labelled "2 Hr Scanning," and several reviews read that as meaning Standard cannot scan daily charts. The opposite is true. Two hours is the finest granularity available, not the coarsest — daily is a wider timeframe than 2-hour, so daily-chart pattern scanning works fine on the entry tier. The limit only blocks intraday scans finer than 2 hours. Swing traders do not need to buy up.
Verdict: the right choice if you scan daily and the subscription is a rounding error against your capital. Hard to justify on a small account.
Finviz — the best value chart pattern screener
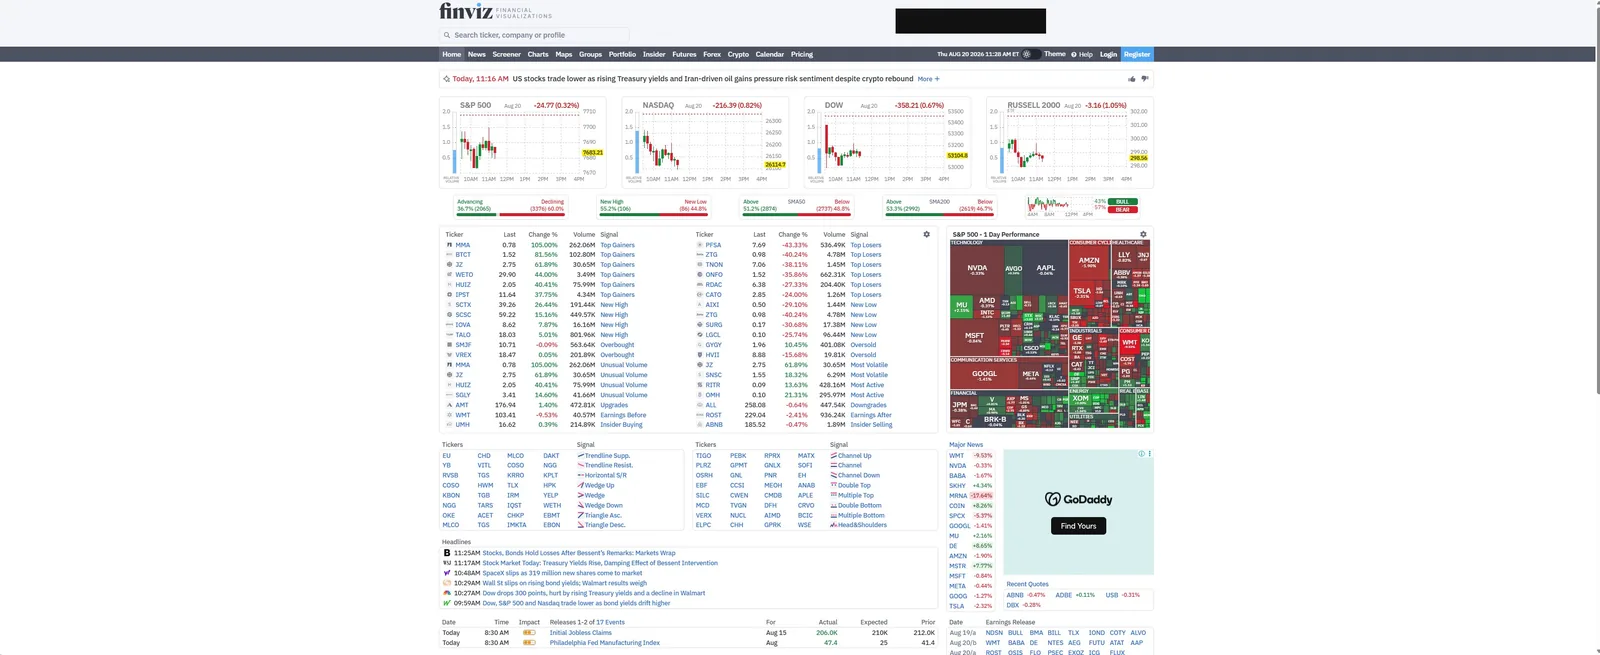
Finviz is where most traders should start, and our founder uses it regularly. The stock screener is excellent, the free tier is genuinely usable rather than a crippled demo, and the Pattern filter does real geometry.
The full list: Horizontal S/R, TL Resistance, TL Support, Wedge Up, Wedge Down, Wedge, Triangle Ascending, Triangle Descending, Channel Up, Channel Down, Channel, Double Top, Double Bottom, Multiple Top, Multiple Bottom, Head & Shoulders, and Head & Shoulders Inverse. Most carry a "(Strong)" variant that tightens the detection threshold.
The important gap: no flag, pennant or cup-and-handle filter. If those are your setups, Finviz will not find them directly — though a symmetrical Wedge combined with a strong performance filter gets you close to a pennant.
Where Finviz shines is combination. Pattern sits in the Technical tab, Relative Volume and Average Volume in the Descriptive tab, and every filter ANDs together in one screen. So "symmetrical wedge, relative volume above 1.5, average volume above 500K, price above $5" is a single URL, not a workaround. Switch to Charts view and you get twenty thumbnails at a time for visual triage.
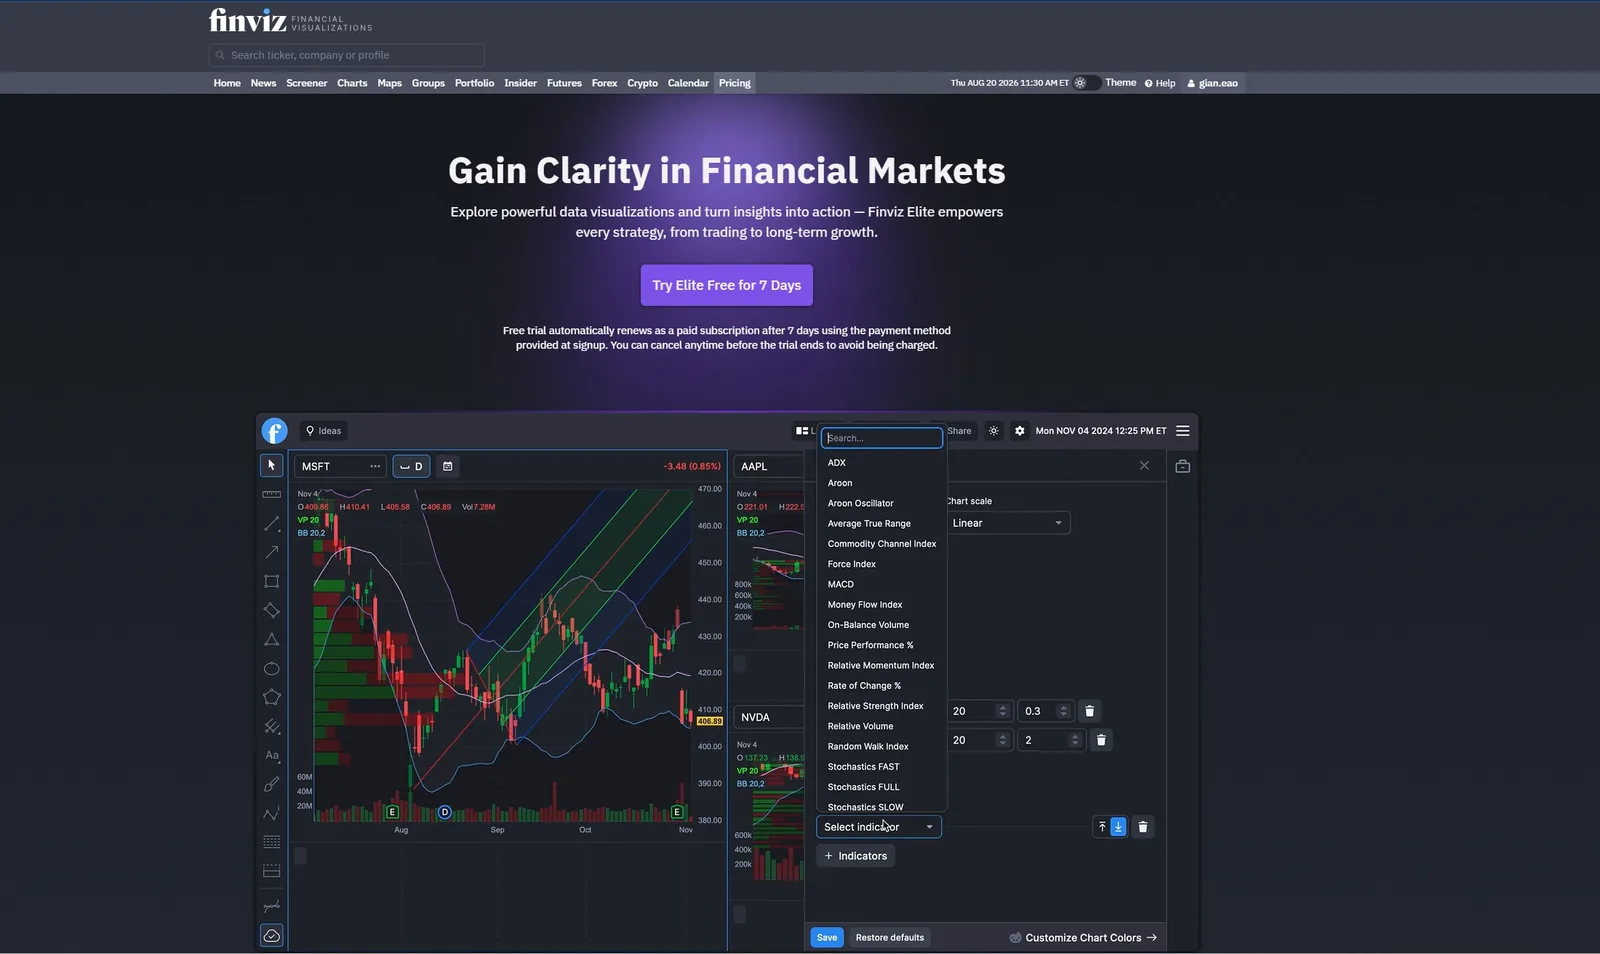
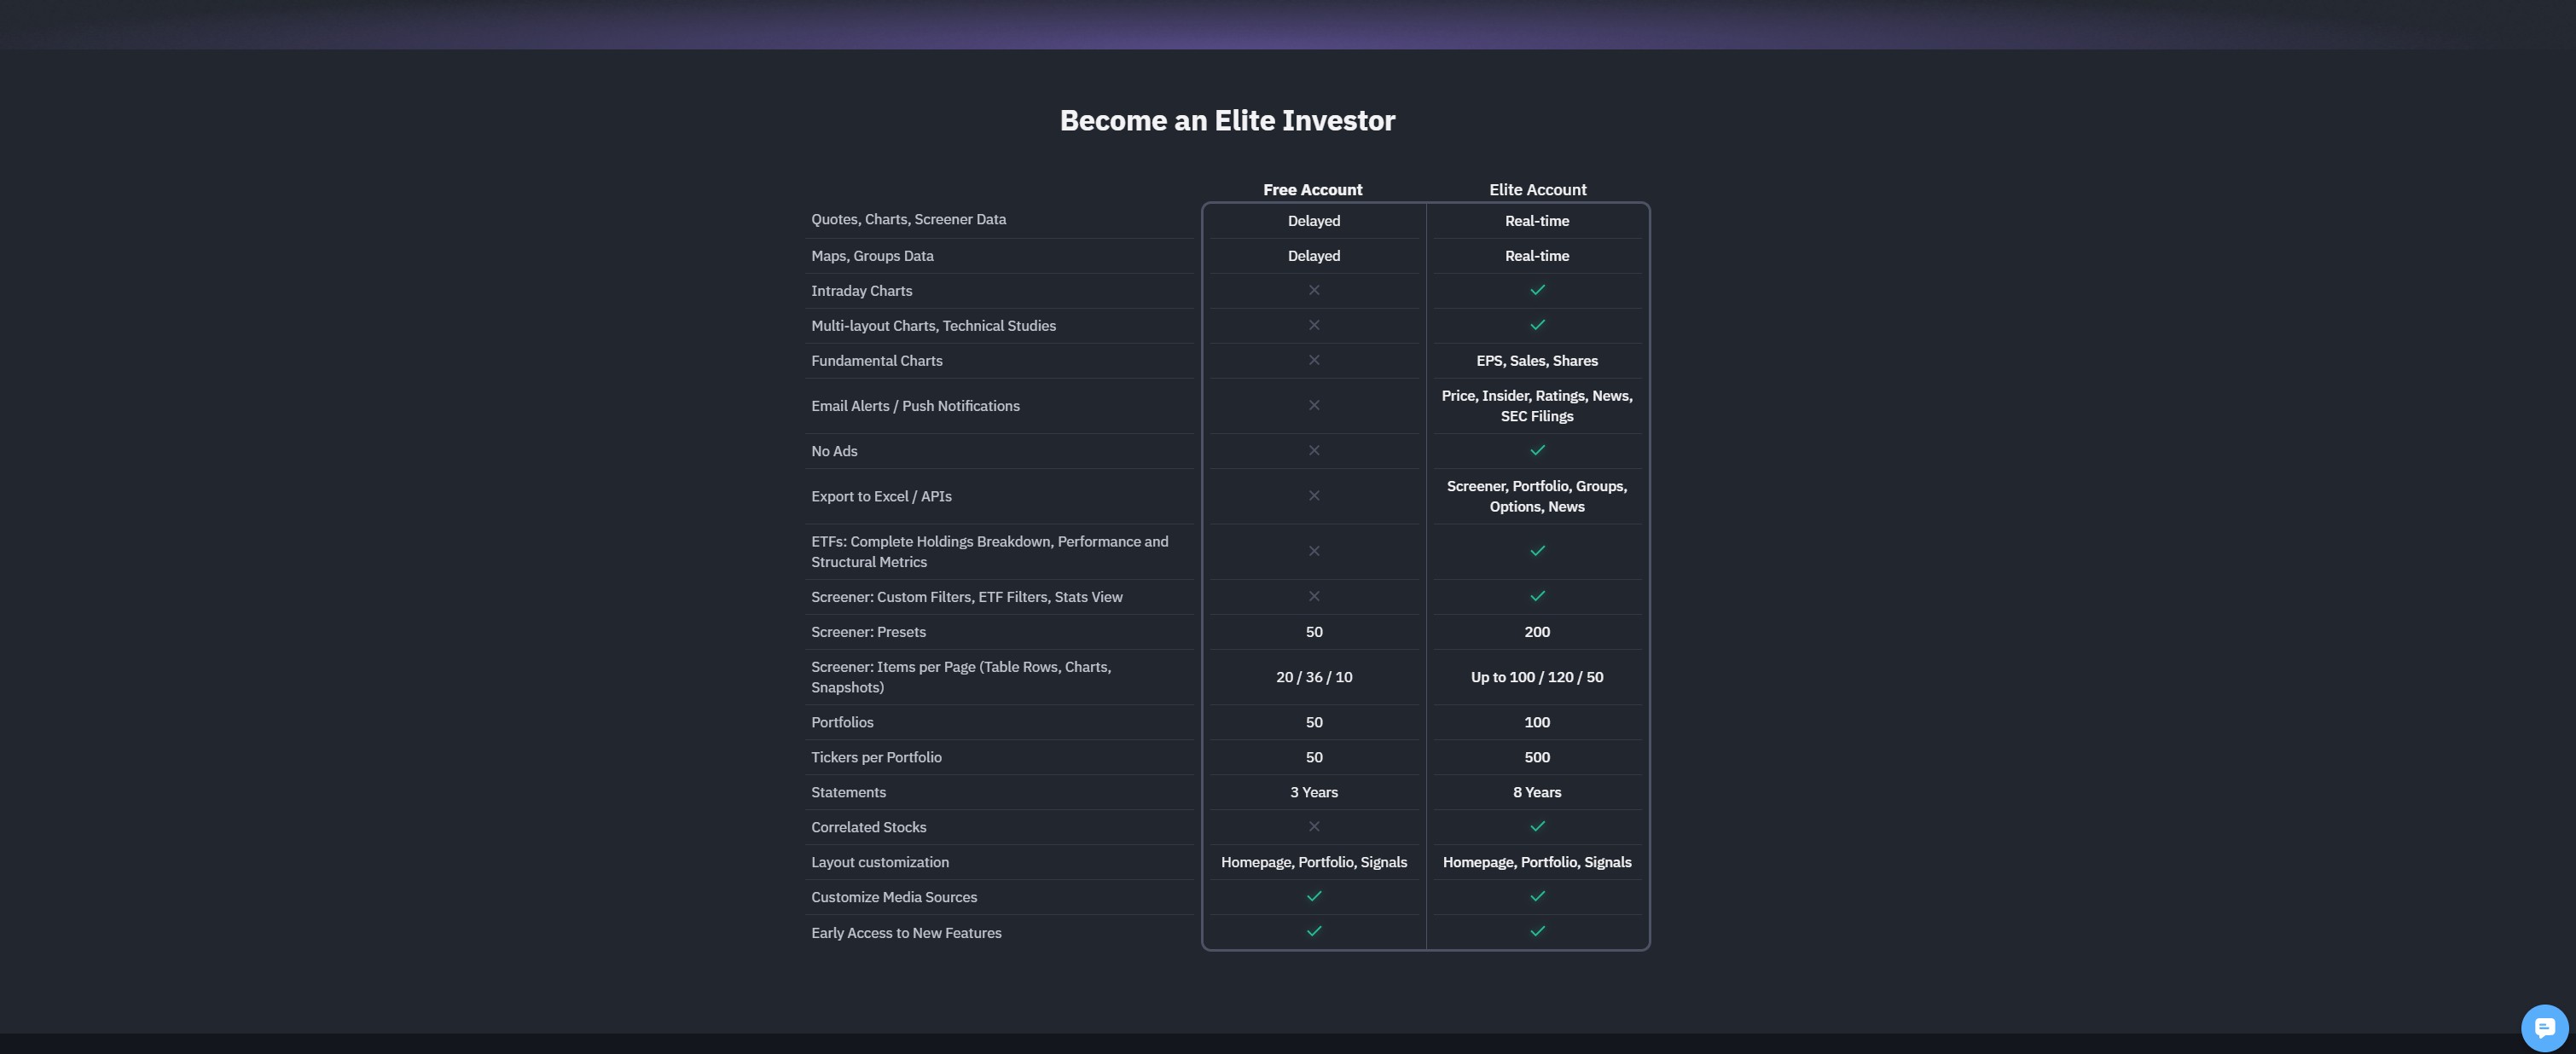
Pricing: the free tier covers daily-timeframe pattern screening. Finviz Elite is $39.50/month or $299.50/year — $24.96/month. Elite adds real-time data, pre-market and after-hours coverage, intraday screener timeframes, daily-bar backtesting, unlimited alerts and CSV export.
Verdict: the best value in the category and the sensible default for swing traders. Try the free tier first — for daily-chart work it may be all you need.
MarketInOut — the widest pattern library, and the one with flags
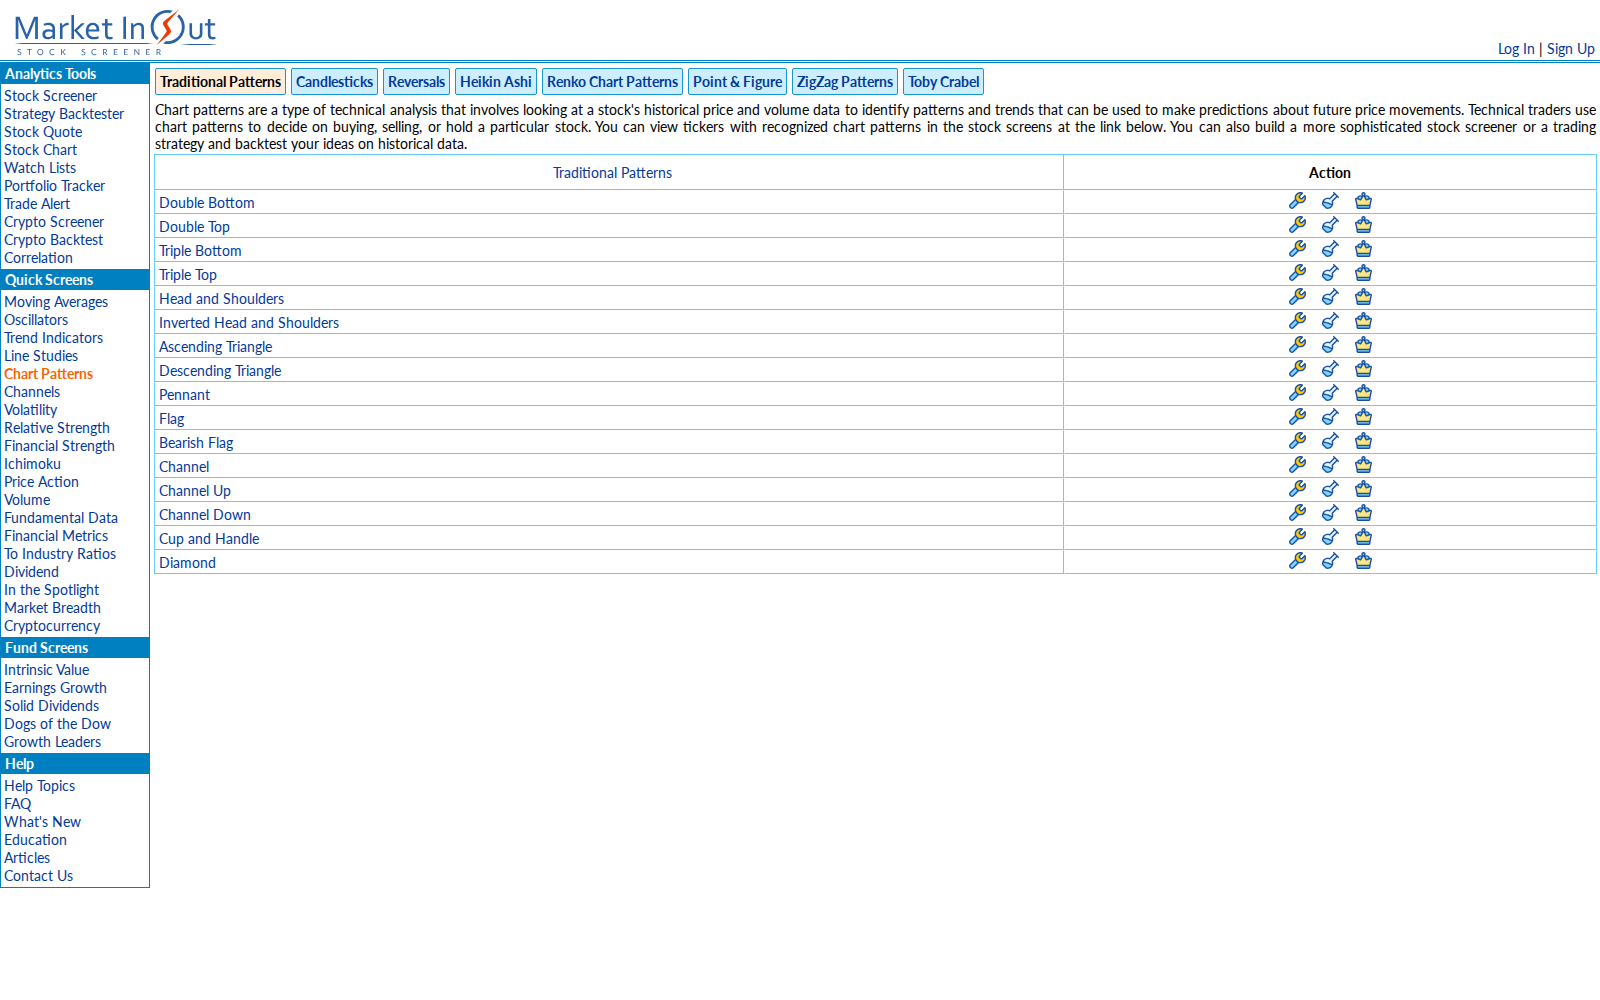
MarketInOut is the least-discussed tool here and arguably the most interesting for flag and pennant traders. Its pattern screener covers ascending and descending triangles, flags, bear flags and pennants, head and shoulders and inverse, channels, double and triple tops and bottoms, cup and handle, and diamonds — noticeably broader than Finviz, and including exactly the formations Finviz lacks. It also has a formula-based screener and backtesting, across NASDAQ, NYSE and around thirty other exchanges.
Pricing: there is no monthly plan. Shortest term is six months at $159 ($26.50/month), one year $259 ($21.58/month), two years $359 ($14.96/month). Quoted excluding VAT, which EU readers should factor in.
Our founder has looked at MarketInOut but not yet run it in anger. We will update this section once it has been properly trialled — on paper it is the strongest cheap option for flag and pennant traders, and that deserves a first-hand verdict rather than a spec-sheet one.
Verdict: the dark horse. The six-month minimum is the friction — a long commitment before you know whether detection quality holds up.
Tickeron — the largest pattern count
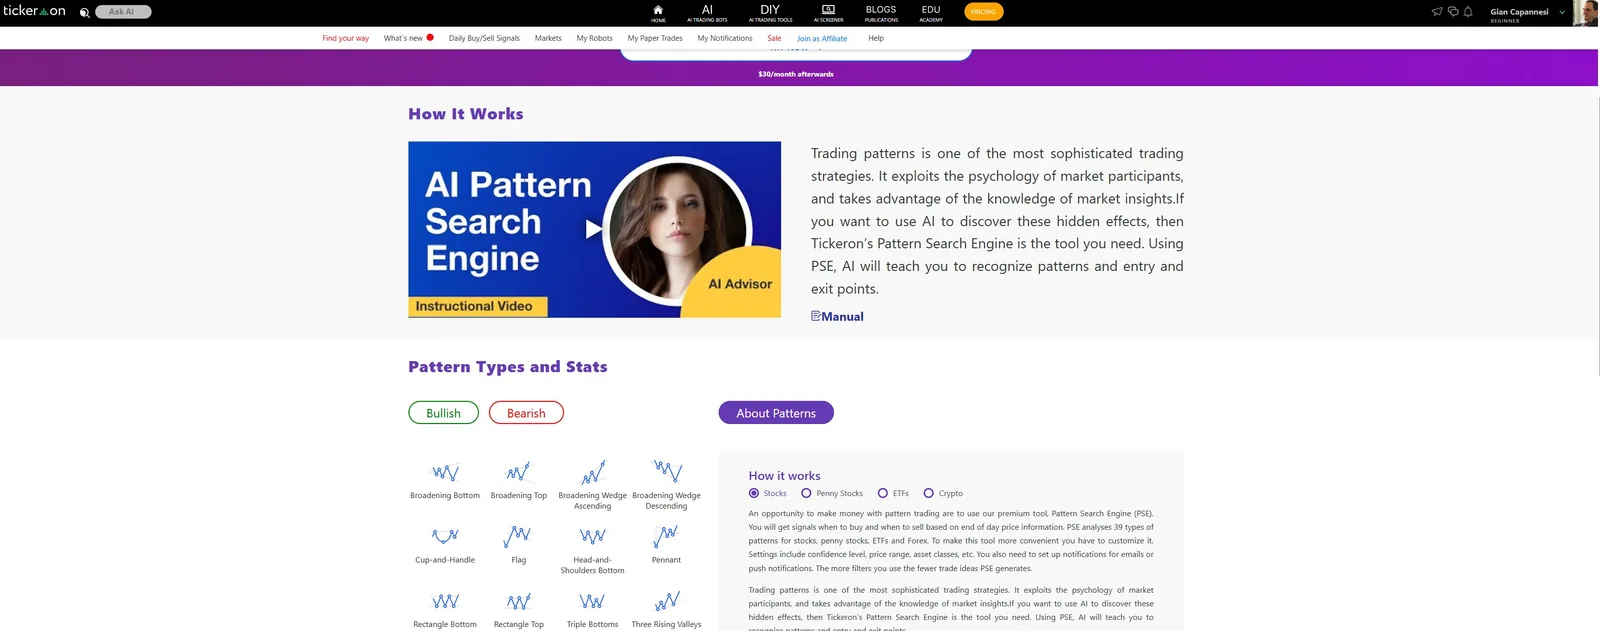
Tickeron runs a Pattern Search Engine that the company states analyses 39 types of chart pattern across stocks, penny stocks, ETFs and forex, with AI confidence scoring layered on top. The broadest pattern coverage we found in a hosted product.
Pricing is the problem. The plan structure is genuinely hard to parse — tiers named Beginner, Intermediate One and Intermediate Two, with prices not published in readable form and third-party reviews contradicting each other wildly. The only figure we could verify from Tickeron directly is on the pattern screener landing page: 14-day free trial, then $30/month. Treat any other number as unreliable until you see it at checkout.
Verdict: worth the free trial for the pattern breadth. Read the billing terms carefully.
ChartMill — a generous free tier and a dated feel
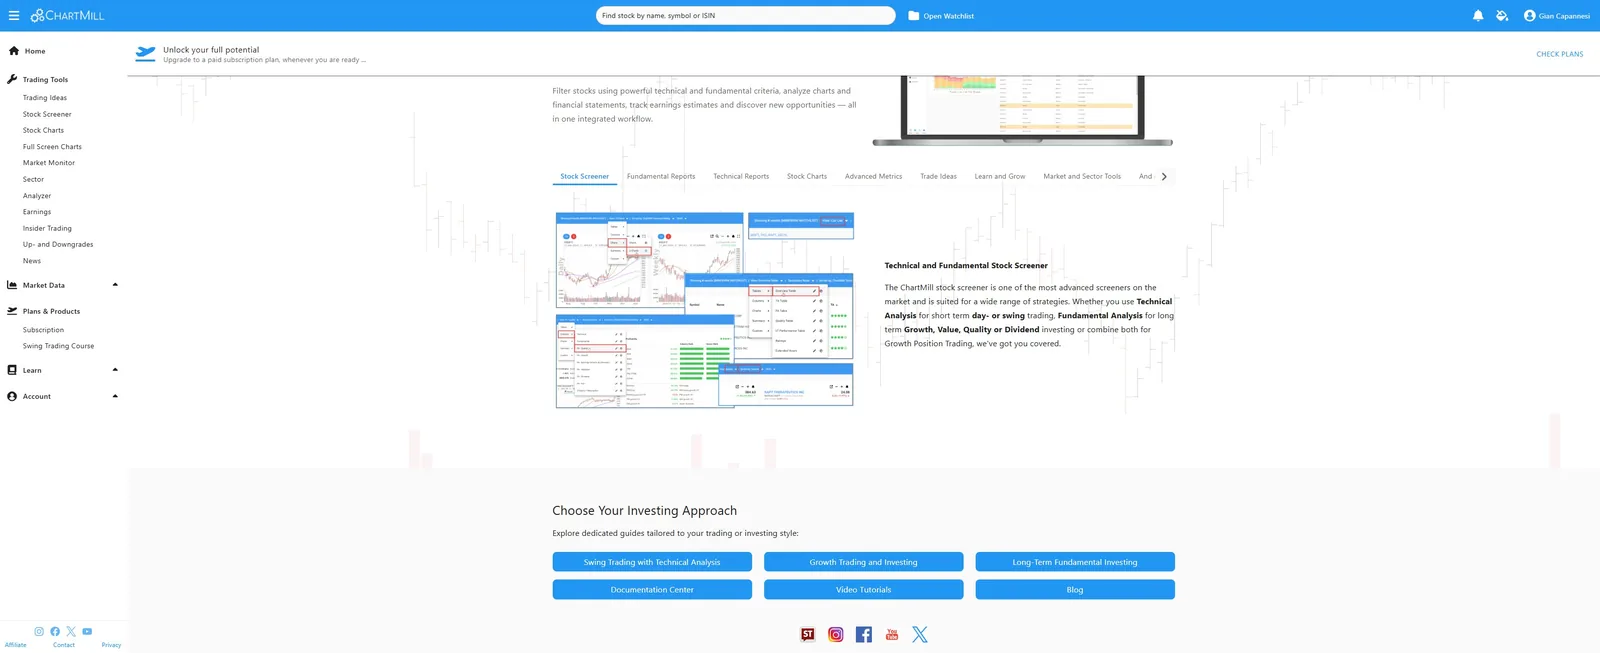
ChartMill documents 29 chart patterns plus 30 candlestick patterns, including flags, pennants, rising and falling wedges and ascending triangles, with pre-built breakout screens that already combine pattern with volume and liquidity filters. On coverage alone it is one of the more complete options at this price.
Our founder has spent some time with it and came away with a mixed impression. The free tier is genuinely generous — you can do real work without paying, which is rare in this category and counts for a lot. The interface, though, feels dated and could use a refresh. That is a first-impressions judgement rather than a deep evaluation, and it is worth being clear that the platform almost certainly has capable features we have not yet explored. We will revisit it properly.
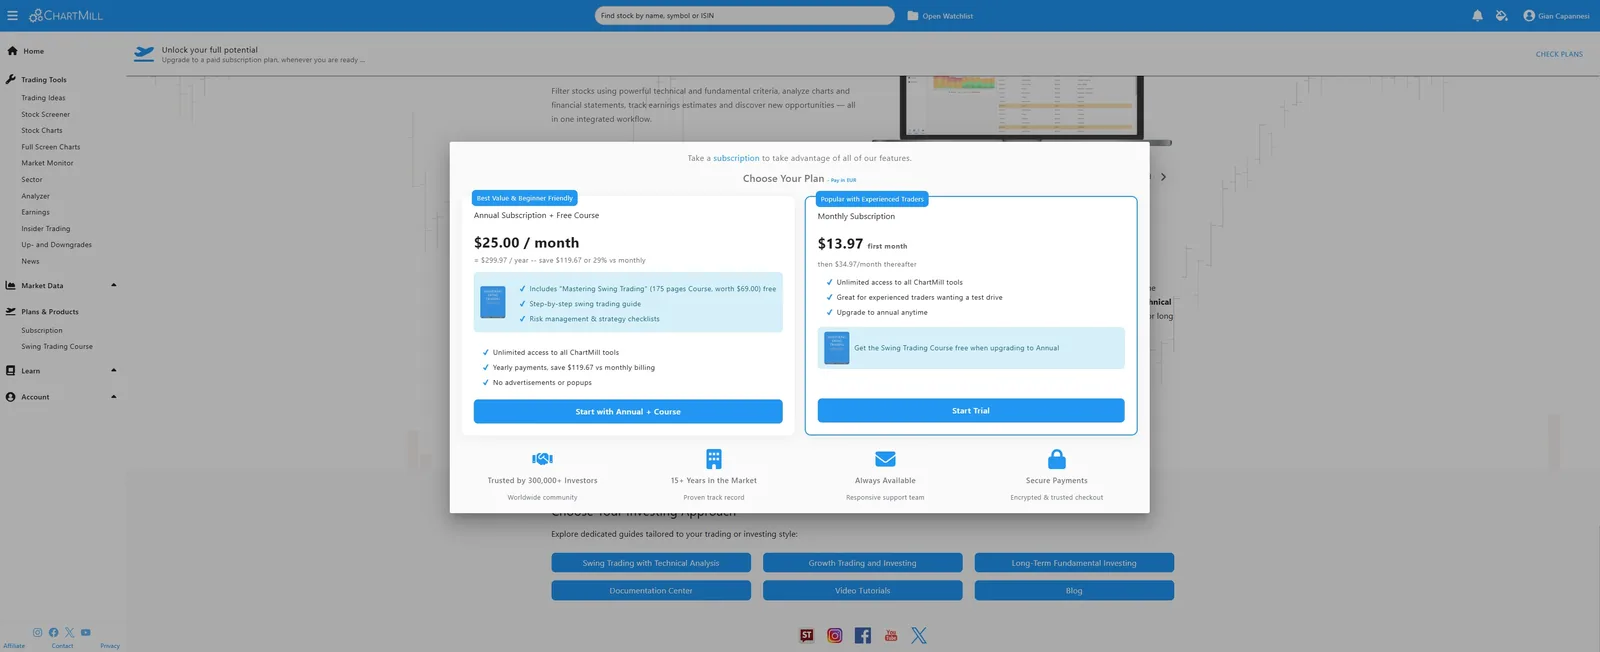
Pricing note: ChartMill's site is a JavaScript application we could not read directly, so these figures are second-hand and should be confirmed on their site: roughly $29.97/month or $259.97/year, with a free tier of around 6,000 credits per month. The credit system means heavy screener use draws down an allowance rather than running unlimited.
Verdict: strong pattern coverage at a low price, and the free credits make it easy to evaluate risk-free. Worth a look if the interface does not bother you.
TradingView — the best charts, no native pattern screener

This one surprises people. TradingView's built-in stock screener has candlestick pattern filters only — around 44 of them, from Abandoned Baby to Tweezer Bottom. There is no native filter for wedges, triangles, flags, pennants, channels or head and shoulders.
Classic geometry exists on TradingView as chart indicators — the Auto Chart Patterns feature draws them beautifully — but those indicators are not exposed as screener columns, and TradingView's own documentation lists the "Patterns" indicator category as unsupported in the Pine Screener.
The workaround is real but fiddly. The Pine Screener runs a community script across a watchlist, and Trendoscope's Chart Patterns Screener is open-source, free and purpose-built for exactly this. Volume logic can be written into the same script, since volume is a standard Pine series. The constraints: the Pine Screener is watchlist-based rather than whole-market (indices to 4,000 symbols, custom watchlists capped at 1,000), it calculates only the last 500 bars, and it runs one indicator at a time.
Pricing: Essential $12.95/month annual, Plus $29.95, Premium $59.95, Ultimate $199.95. Monthly billing is roughly $14.95 / $34.95 / $69.95 / $239.95.
Which tier unlocks the Pine Screener is genuinely unclear. Third-party sources consistently say Premium, but TradingView's own help documentation states no plan requirement anywhere and their feature matrix rendered inconsistently across repeated checks. Confirm in-app before subscribing — it is a $30/month difference.
Verdict: unbeatable for charting and for drawing patterns. A compromised choice if scanning is the job.
TC2000 — excellent scanner, wrong tool for patterns
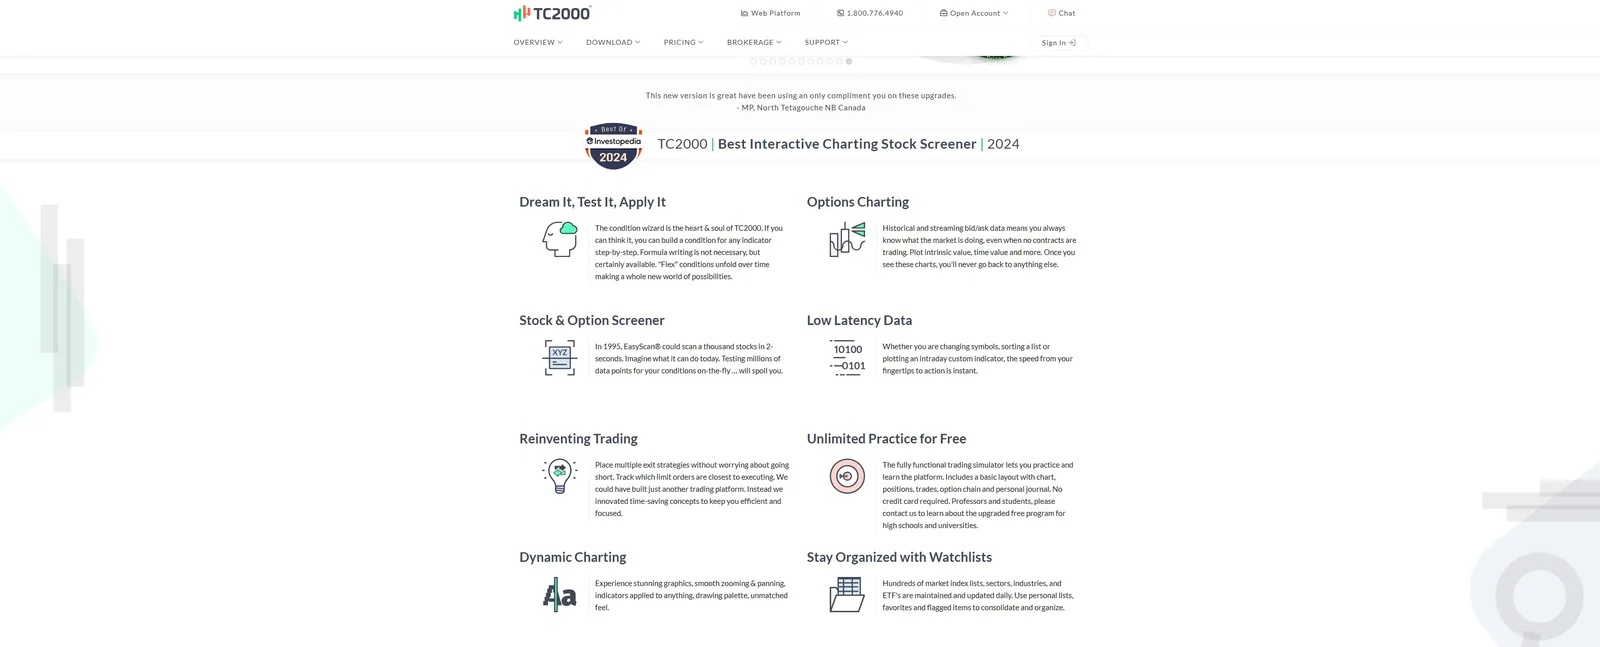
TC2000 has one of the fastest real-time scan engines available and a devoted following among day traders. But its pattern library is Japanese candlestick formulas only — TC2000's own help documentation lists Basic Candle, Bullish and Bearish candlestick formulas and nothing resembling classic chart geometry. Wedges, triangles, flags and cup and handle must be hand-coded as Personal Criteria Formulas, which is possible but is a programming exercise, not a feature.
Our founder rates TC2000 as good software but has never used it for pattern scanning specifically — which, given the above, is the correct instinct.
Pricing: Basic $24.99, Premium $49.99, Premium+ $99.99 per month. Note that real-time exchange data is not included in any tier and is charged as a separate $1.50–$25.00 monthly add-on. Annual pricing exists but is not clearly published — do not assume a discount.
Verdict: buy it for scan speed and formula flexibility, not for pattern recognition.
Barchart — candlesticks only
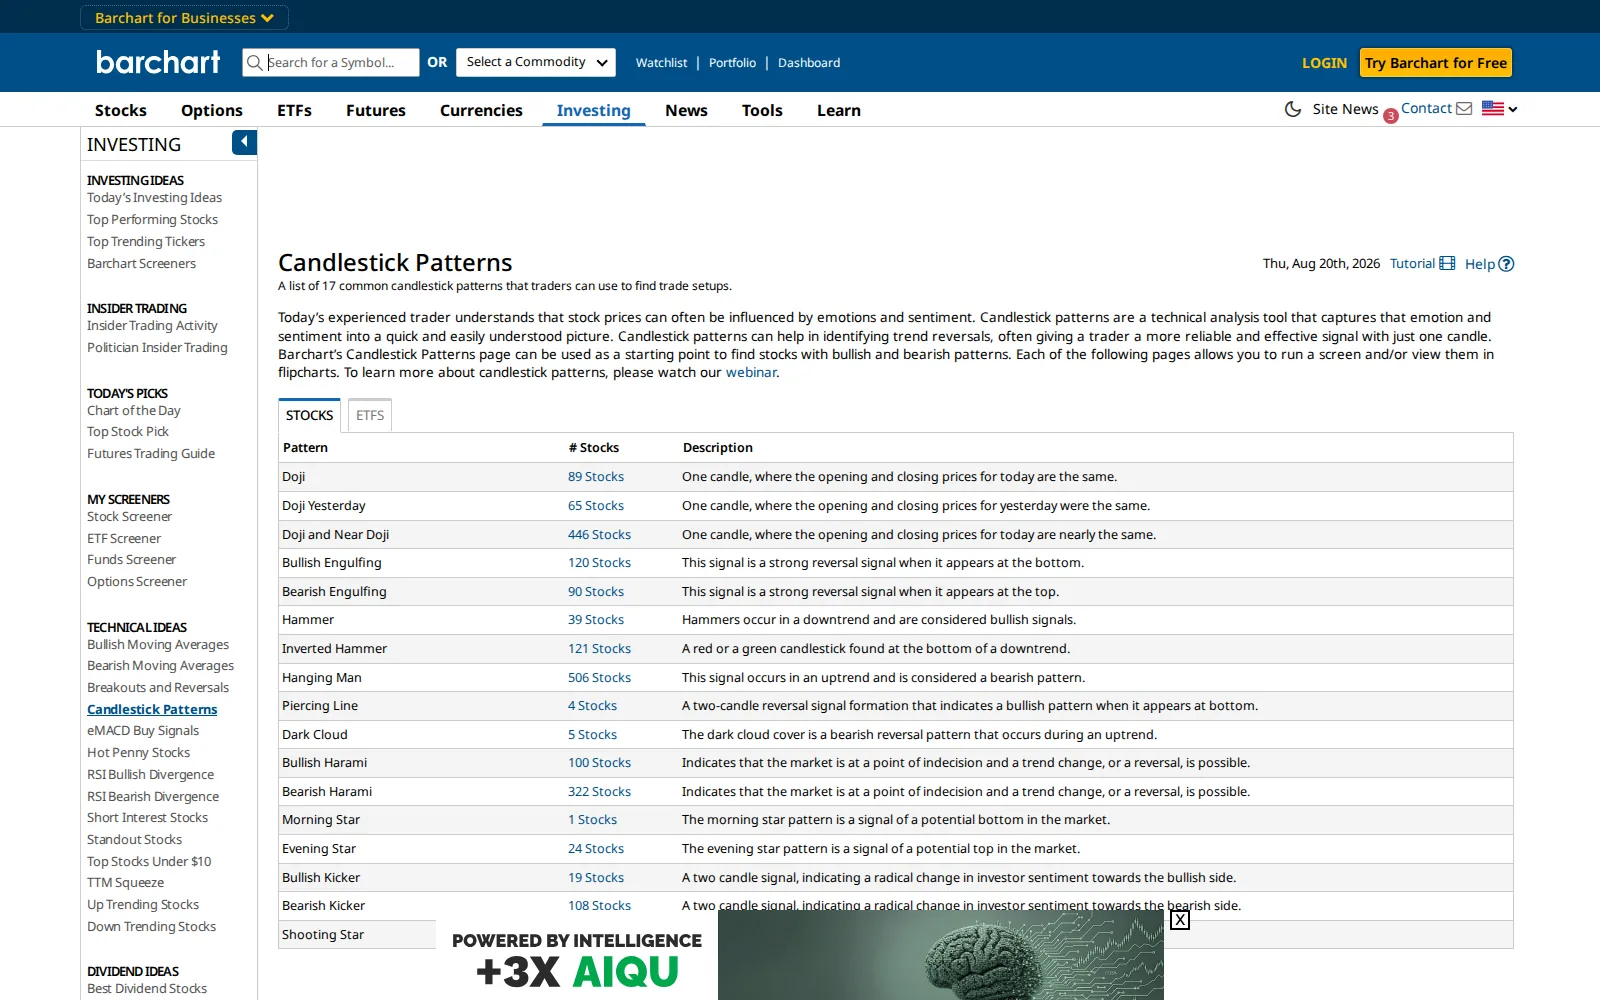
Barchart is a good data site with a strong screener, and our founder uses it. But on chart pattern scanning specifically, it does not do what its marketing implies.
Barchart's pattern scanner covers 17 candlestick patterns — doji, engulfing, hammer, harami, morning and evening star, kicker, shooting star. There is no triangle, wedge, flag, pennant, channel or head and shoulders detection anywhere on the platform. Barchart's own article about six major chart patterns describes them being detected by Tickeron, a third-party vendor, not by Barchart.
One useful mechanic: each candlestick pattern list has a link that pushes matching symbols into Barchart's full screener, where Volume, Average Volume and Relative Volume are available as filters. So pattern-plus-volume is achievable as a two-step handoff rather than one view.
Pricing: the free tier is capped at 20 page views per day, which serious research exhausts fast. Plus is $9.99/month or $99/year ($8.25/month), Premier $29.95/month or $239.95/year ($19.95/month). Both paid tiers include a 30-day free trial. Free users see truncated screener results, so Plus is the practical minimum.
Verdict: excellent for data, watchlists and options tooling. Not a chart pattern scanner.
StockCharts — candlesticks and Point & Figure
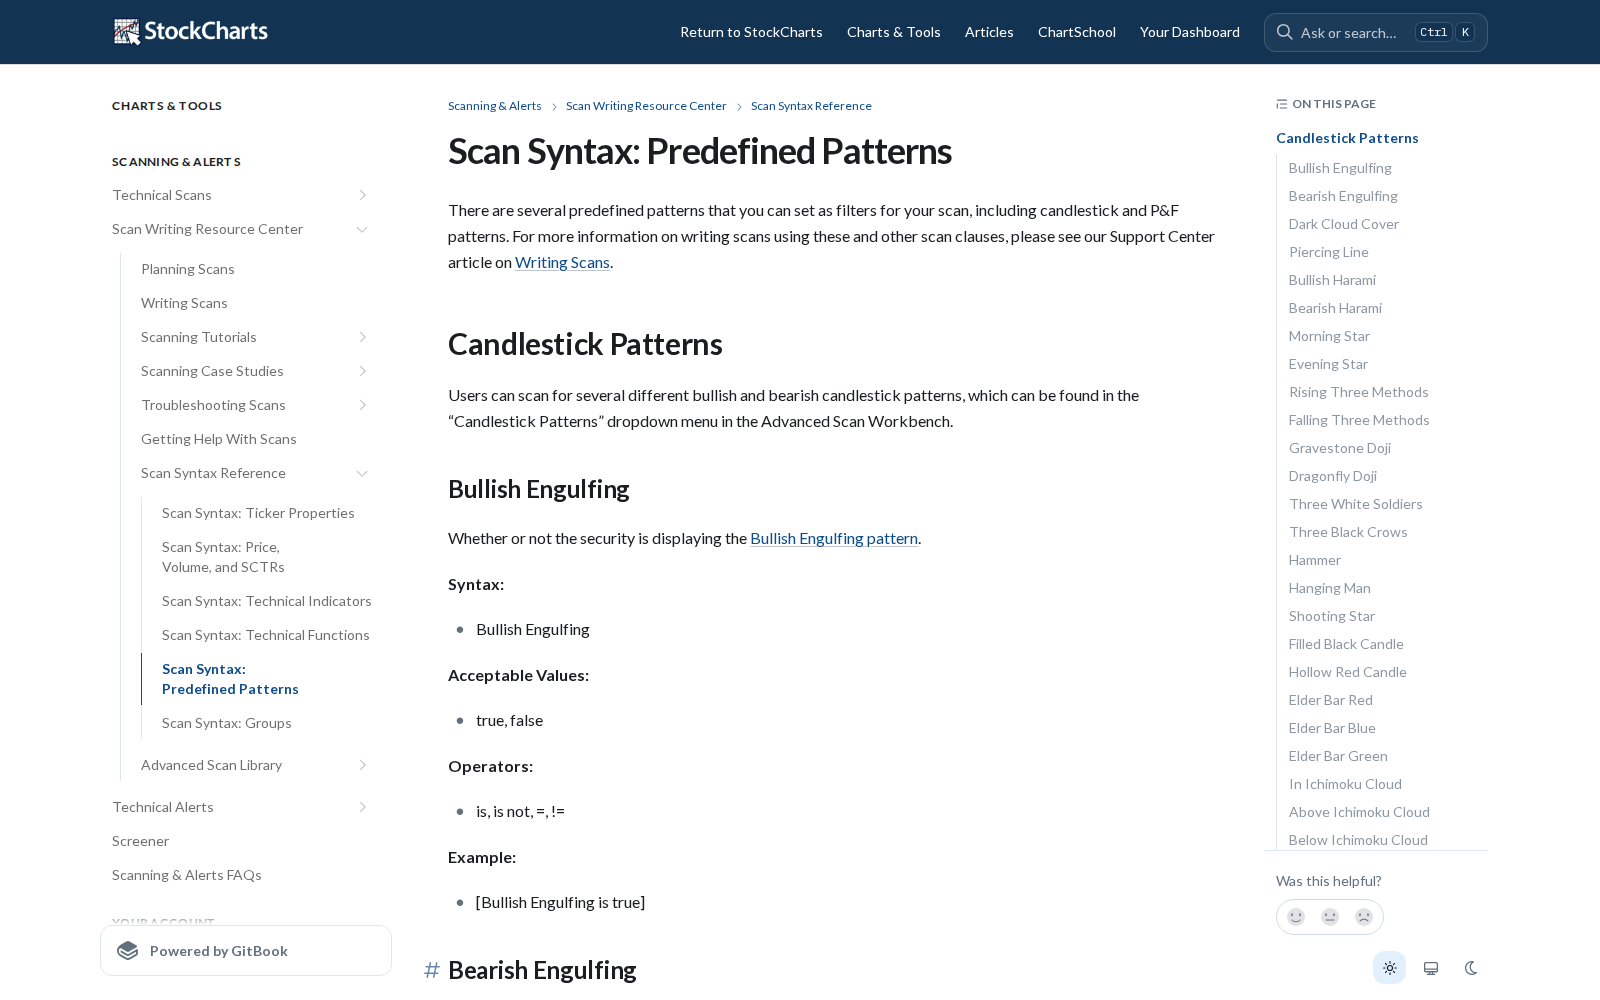
StockCharts' scan engine supports predefined candlestick patterns and Point & Figure patterns — P&F triangles, triple-top breakouts and similar. Point & Figure triangles are legitimate pattern detection, but they are a different chart construction entirely and will not find a time-series wedge or flag.
Pricing: Basic $14.95, Extra $24.95, PRO $39.95 per month. Annual billing includes 13 months for the price of 12, so effective rates are about $13.80, $23.03 and $36.88. Free trial is one month at the Extra level.
Verdict: great charting and annotation, weak on classic chart geometry scanning.
Deepvue — no pattern detection at all
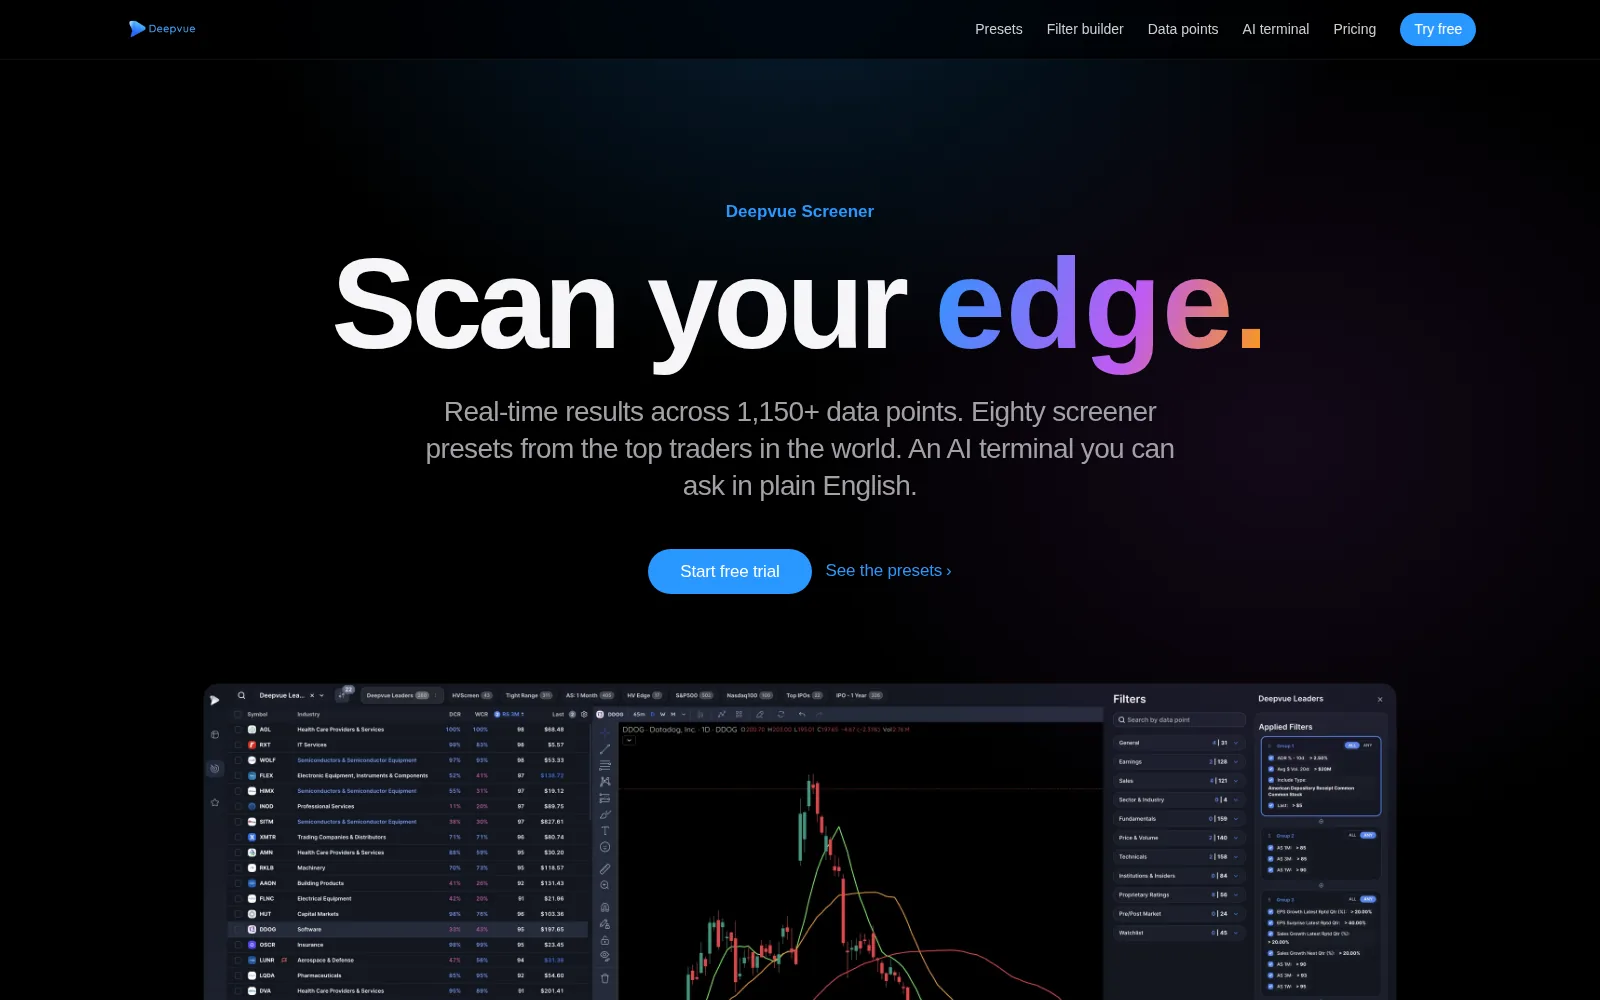
Deepvue markets hard to momentum and swing traders, and its volume filtering is genuinely deep — relative volume across 5, 10, 20 and 50-day lookbacks, run rate, up/down volume ratios, dollar volume, "highest volume since earnings," float turnover.
But on chart patterns, Deepvue's own comparison pages list automatic pattern recognition as "not yet — on the roadmap." What it offers instead are indicator proxies: Relative Measured Volatility, three-weeks-tight, percentage-range compression, and a Minervini-style power play preset that approximates a volatility contraction pattern numerically.
Pricing: a single flat plan at $49/month, or $41/month billed annually, with a 30-day free trial that does not require a card. No permanent free tier. Note their /pricing page currently 404s, so these figures come from Deepvue's own comparison articles rather than a canonical price list.
Verdict: a very good momentum and volume screener. Not a chart pattern scanner, and it does not claim to be — buy it for what it is.
Free chart pattern scanners worth knowing about
Two genuinely free options get overlooked because they are bundled rather than sold.
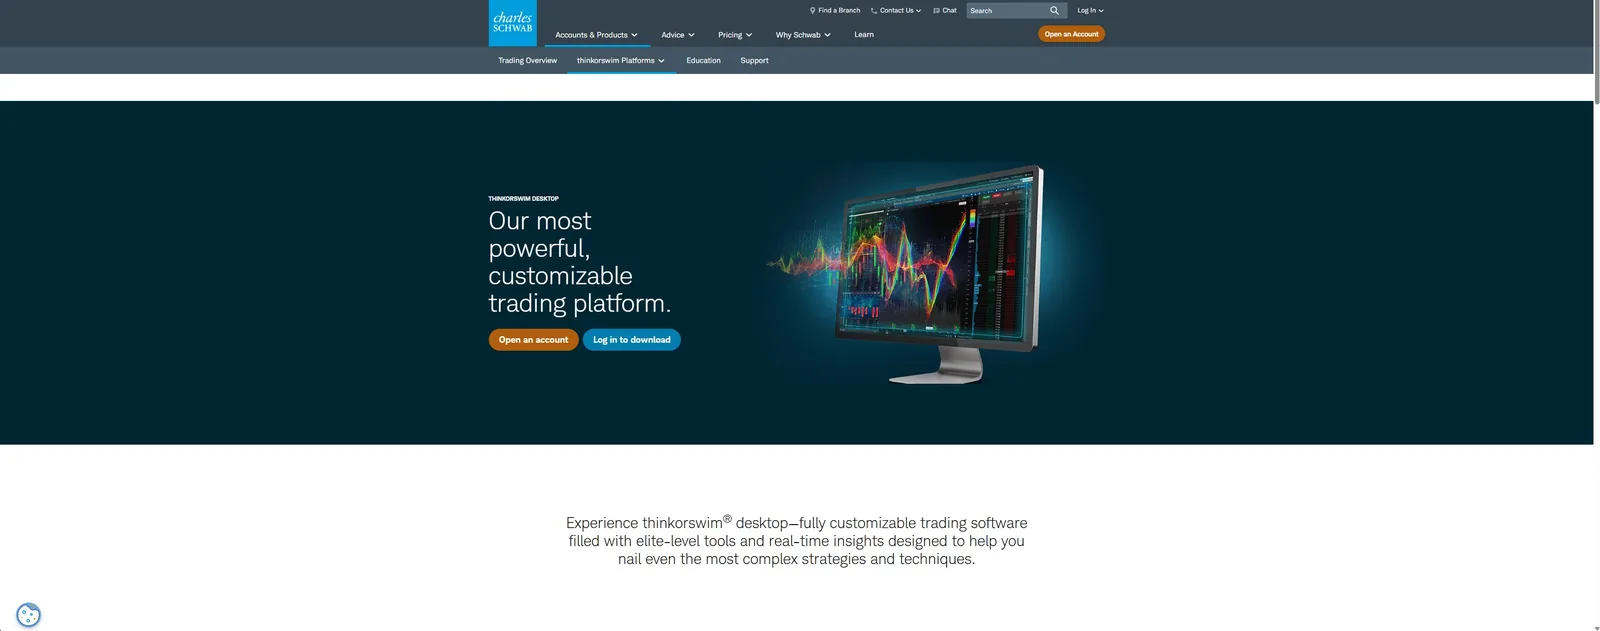
thinkorswim (Schwab). The Stock Hacker scanner includes Classic Patterns as a scan filter, and the pattern settings expose sensitivity controls for pattern length, bullish or bearish direction, continuation versus reversal, breakout strength and — importantly — volume increase. That is pattern-plus-volume as a native scan at no monthly cost, on a platform many traders already have. It also explains why "thinkorswim bull flag scanner" is a recurring search: the capability is there, it is just buried. The requirement is a funded Schwab account, which is the barrier for non-US traders.
Trading Central (formerly Recognia).

Bundled free inside Interactive Brokers, Schwab, ETRADE and Fidelity. Technical Insight auto-detects triangles, wedges, flags, pennants*, channels, head and shoulders and continuation patterns, tags each with a price target and expected duration, and lets you screen by them. For internationally based traders, Interactive Brokers is usually the accessible route.
If either is available to you, run it before paying anyone.
The one-time-purchase route
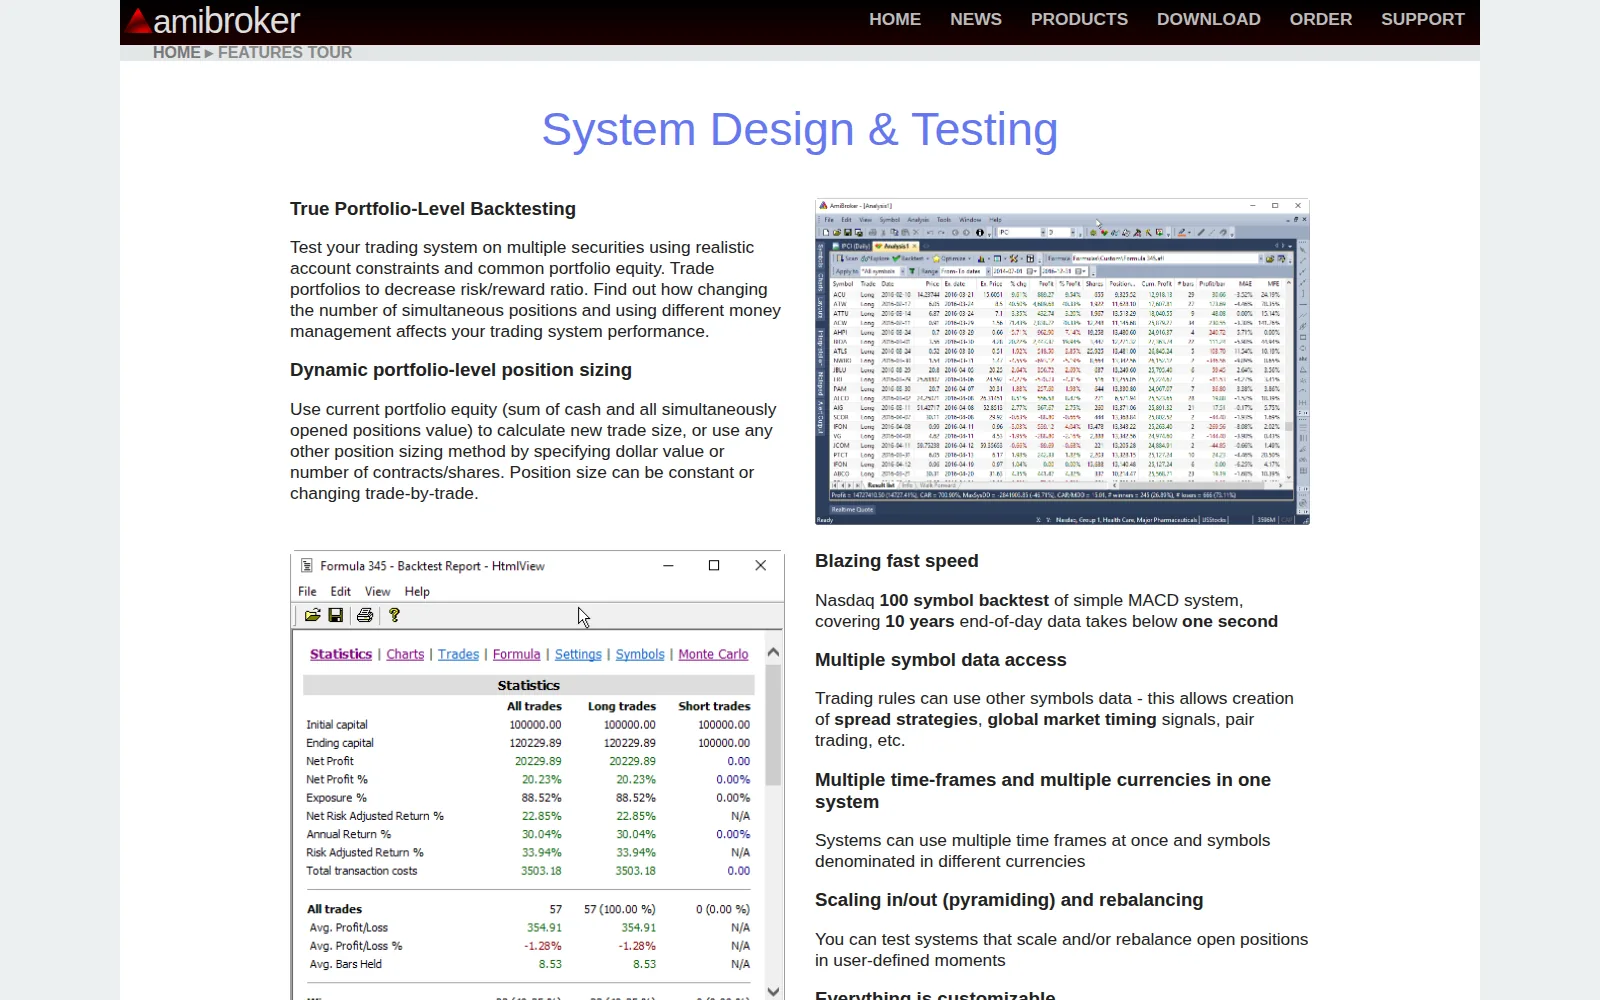
For traders allergic to subscriptions, AmiBroker is a perpetual licence: Standard $299, Professional $379, Ultimate Pack $499, one-time, with 24 months of updates included. It ships with no pattern detection built in, but its AFL scripting language handles geometry well and free community AFL code exists for triangles, wedges and channels.
Add WiseTrader Toolbox at $299 one-time for AFL-callable detection of triangles, trendlines, head and shoulders, double tops and bottoms and harmonics. Around $600 all-in, forever, with total control over volume conditions. Data can come free from Stooq or Yahoo via AmiQuote, or from Norgate ($270–$787/year) for survivorship-bias-free history including delisted names.
The catch is the learning curve. AFL is an array-based language and the interface is dated. Budget a few weekends before you have a working custom pattern scan.
Worth ruling out explicitly: MetaStock has a one-time option but no classic pattern geometry detection, and Optuma — despite costing $150+ per user per month on a 12-month minimum — does not auto-identify classic chart patterns either. Its Pattern Matcher is a manual template-matching tool with no concept of a "wedge" or "triangle."
Building your own chart pattern scanner
This is less exotic than the pricing in this market implies. Detecting a wedge or triangle is a defined procedure: find swing highs and lows, fit a line to each, test whether the lines converge, confirm the apex sits ahead of price rather than behind it, then layer a volume-contraction test and a range-compression test on top.
In Python, with free daily data from Stooq or yfinance, that produces a scanner over the entire US market that outputs a ranked CSV plus a chart image per candidate with the trendlines drawn. The filters are yours to tune rather than someone else's black box, and the running cost is zero.
The efficient design applies liquidity and momentum filters first — dollar volume floor, relative volume threshold, percentage gain over a lookback — cutting roughly 8,000 tickers to a few hundred before any expensive geometry fitting runs. That turns a slow job into one that finishes in minutes.
Two honest caveats apply to home-built and commercial detectors equally. Pivot-based detection confirms swings retroactively, so a pattern appears a few bars after it forms — anything claiming otherwise is repainting. And no scoring system removes the need for a visual pass; it just puts the good candidates at the top.
TTH is building exactly this, and we will publish the code when it is ready.
Two chart pattern screens that work
Bull flag / continuation setup (daily):
- Pattern: Channel Down, or Wedge if your tool lacks flags
- Performance: month or quarter up 20%+ — the flagpole
- Performance: week flat or slightly down — the pullback
- Relative volume during consolidation below 1.0 — the dry-up
- Price above the 20-day and 50-day moving averages
- Average volume above 500K, price above $5
Pennant / coil setup (daily):
- Pattern: Wedge (symmetrical) or Triangle Ascending
- Performance: strong prior advance over 1–3 months
- Volatility this week below volatility this month — the contraction
- Average volume above 500K
- Then watch for a breakout bar at 1.5–2× the 50-day average volume
Run either as a nightly scan, switch to chart-thumbnail view, and discard whatever the algorithm drew badly. Expect to keep perhaps a third of what the scanner returns. That is normal and not a failure of the software — geometric detection is loose by nature, and the value is reducing 8,000 candidates to thirty, not making the final call for you.
Which chart pattern scanner should you use?
Swing trading on a budget: Finviz. Start free, upgrade to Elite at $24.96/month annual if you need real-time data or backtesting. Accept that flags and pennants are not in the list.
Flags and pennants are your core setups: MarketInOut or ChartMill — the only two affordable tools with those formations. Trial before committing, and note MarketInOut's six-month minimum.
You want the best and the budget is there: TrendSpider. Best detection in the category, excellent support. Standard at $54/month annual is sufficient for daily-chart work despite what the "2 Hr Scanning" label suggests.
You already have a brokerage account: check thinkorswim's Classic Patterns or Trading Central inside your broker before paying anyone. Both are free and both do genuine geometry with volume.
You day trade: you need real-time intraday pattern detection — TrendSpider Premium or higher, or thinkorswim with a Schwab account. The cheap daily-chart tools will not serve you.
You hate subscriptions: AmiBroker plus WiseTrader Toolbox, roughly $600 once.
You can code: build it. The logic is not the hard part, and you end up with something tuned to your setups rather than someone else's.
Frequently asked questions
Does Finviz scan for bull flags or pennants? No. Finviz's Pattern filter covers wedges, triangles, channels, double and multiple tops and bottoms, head and shoulders, and trendline support and resistance — but there is no flag, pennant or cup-and-handle option. The closest approximation is combining a symmetrical Wedge or Channel Down with a strong prior-performance filter to capture the flagpole.
What is the best free chart pattern scanner? Finviz's free tier for daily-chart geometry, or thinkorswim's Stock Hacker if you have a funded Schwab account — the latter includes volume-increase sensitivity in its Classic Patterns filter and is the more capable of the two. Trading Central inside Interactive Brokers is the best free option for traders outside the US.
Can TradingView scan for chart patterns? Not natively. TradingView's screener detects candlestick patterns only. Classic geometry requires running a community script such as Trendoscope's open-source Chart Patterns Screener through the Pine Screener, which is watchlist-based and limited to the last 500 bars.
How accurate is automated chart pattern recognition? Loose, on every platform. Detection algorithms fit trendlines to swing points and will label formations no discretionary trader would call a wedge. Treat any pattern scanner as a shortlisting tool that cuts thousands of candidates to a few dozen, then apply your own eye.
Do I need volume confirmation on chart patterns? Yes, and it is the most commonly skipped step. Every classic pattern has a volume signature — contraction through the consolidation, expansion on the breakout. A textbook-looking bull flag forming on rising volume is more likely distribution than accumulation, and a head and shoulders is only meaningful if volume declined from the left shoulder to the right.
Which chart pattern scanner works on intraday timeframes? TrendSpider (5-minute on Premium, 1-minute on Enhanced and above), Finviz Elite (1-minute through hourly in the screener, though whether the Pattern filter itself recomputes on intraday bars is not documented), and thinkorswim. Most other tools here are daily-timeframe or delayed-data products.
What is the difference between a flag and a pennant? Both follow a sharp advance. A flag consolidates between two roughly parallel lines that drift against the trend; a pennant consolidates between two converging lines, forming a small symmetrical triangle. Pennants are usually shorter and show a sharper volume contraction.
Pricing verified against vendor pricing pages in August 2026. ChartMill, Tickeron and TradingView's Pine Screener tier requirement could not be confirmed directly from those vendors' own sites and are flagged in the relevant sections. Search volume referenced during research is from Google Keyword Planner, United States, August 2026. We update this article as prices change and as first-hand testing is completed — MarketInOut is next.